Short Answer: Yes!
In my dealings with customers I’ve been requesting performance data from their storage systems whenever I can to see how different applications and environments react to new features. Today I’m going to give you some more real-world data, straight from a customer’s production EMC NS480.
I’ve pulled various stats out of Analyzer for this customer’s Exchange server, which has 3 mail databases totaling about 1TB of mail stored on the NS480 via FibreChannel connect. Since this customer is not extremely large (similar to most of our customers) they are using this NS480 for pretty much everything from VMWare, SQL, and Exchange, to NAS, web/app content, and Business Intelligence systems. There is about 30TB of block data and another 100TB of NAS data. FASTCache is enabled for all LUNs and Pools with just 183GB of usable FASTCache space (4 x 100GB SSDs). So in this environment, with a modest amount of FASTCache and very mixed workload, how does Exchange fare?
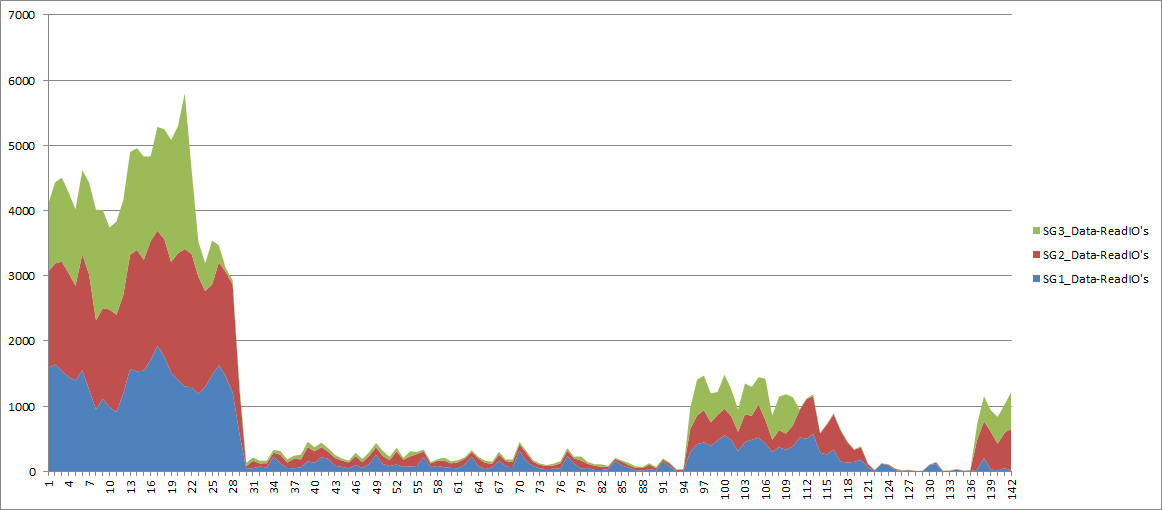
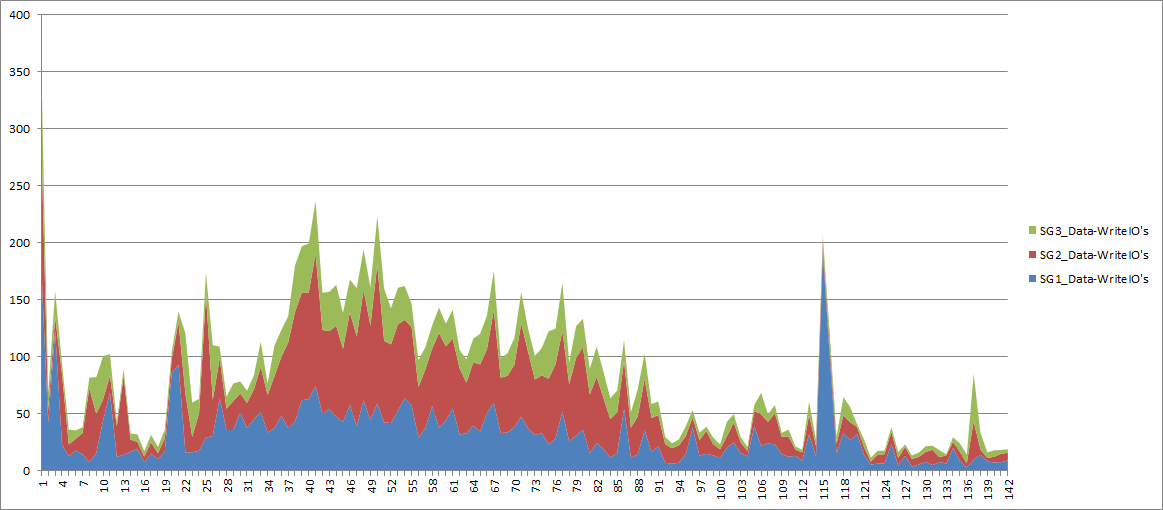
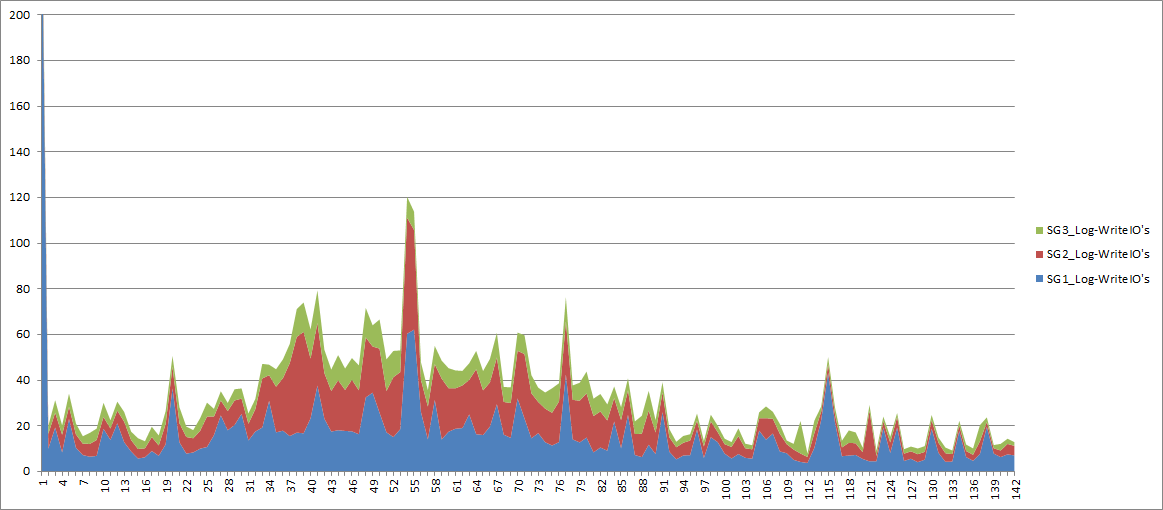
Let’s first take a look at the Exchange workload itself for a 24 hour period: (Note: There were no reads from the Exchange log LUNs to speak of so I left that out of this analysis.)
Total Read IOPS for the 3 databases: (the largest peak is a result of database maintenance jobs and the smaller peaks are due to backup jobs) Here it’s tough to see due to the maintenance and backup peaks, but production IO during the work day is about 200-400IOPS. By the way, a source-deduplicating incremental-forever backup technology, such as Avamar, could drastically reduce the IO Load and duration of the nightly backup
Total Write IOPS for the 3 databases: Obviously more changes to the database occurring during the work day.
Total Write IOPS for the 3 Log files: Log data is typically cached easily in the SP cache so FAST Cache isn’t terribly required here but I’m including it to show whether there is any value to using FASTCache with Exchange logs.
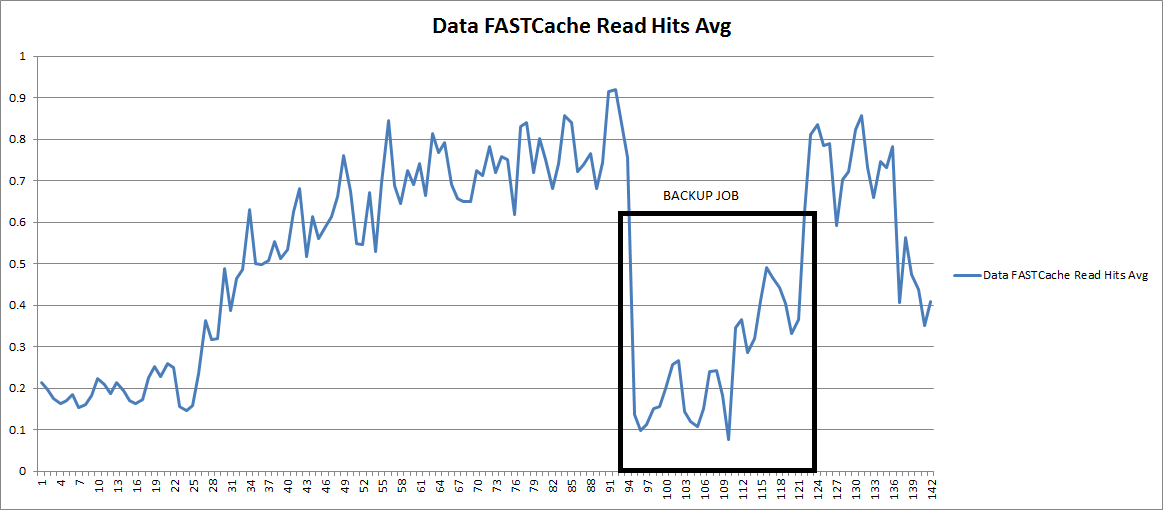
Now let’s look at the FASTCache hit ratios for this same set of data: (average of all 3 DBs)
First, the Read Activity: Here you can see that aside from the maintenance and backup jobs, FASTCache is servicing 70-90% of the Read IOPs. Keep in mind that a FASTCache miss could still be a Cache Hit if the data is in SP Cache. What’s interesting about this is that it looks like the nightly maintenance job is pushing the highest load.
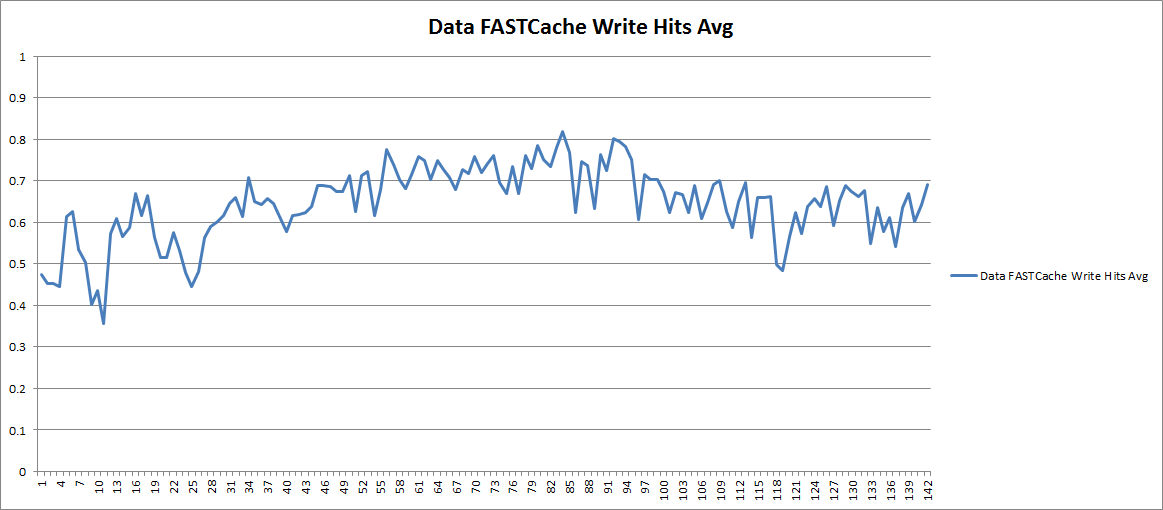
And the Write Activity: The beauty of EMC’s FASTCache implementation being a read/write cache, the benefit extends beyond just read IO. Here you see that FASTCache is servicing 60-80% of the writes for these Exchange Databases. That’s a huge load off the backend disks.
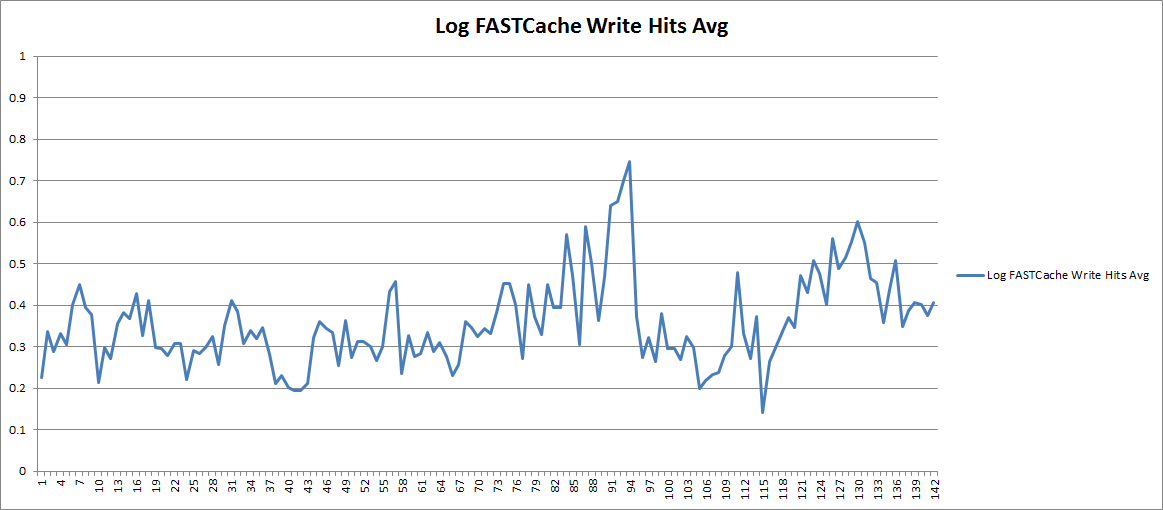
And the Log Writes: Since Log writes are usually not a performance problem, I would say that FASTCache is not necessary here, and the average 30% hit ratio shown here is not great. If you wanted to spend the time to tune FASTCache a bit, you might consider disabling FASTCache for Log LUNs to devote the FASTCache capacity to more cache friendly workloads.
All in all you can see that for the database data, FASTCache is servicing a significant portion of the user generated workload, reducing the backend disk load and improving overall performance.
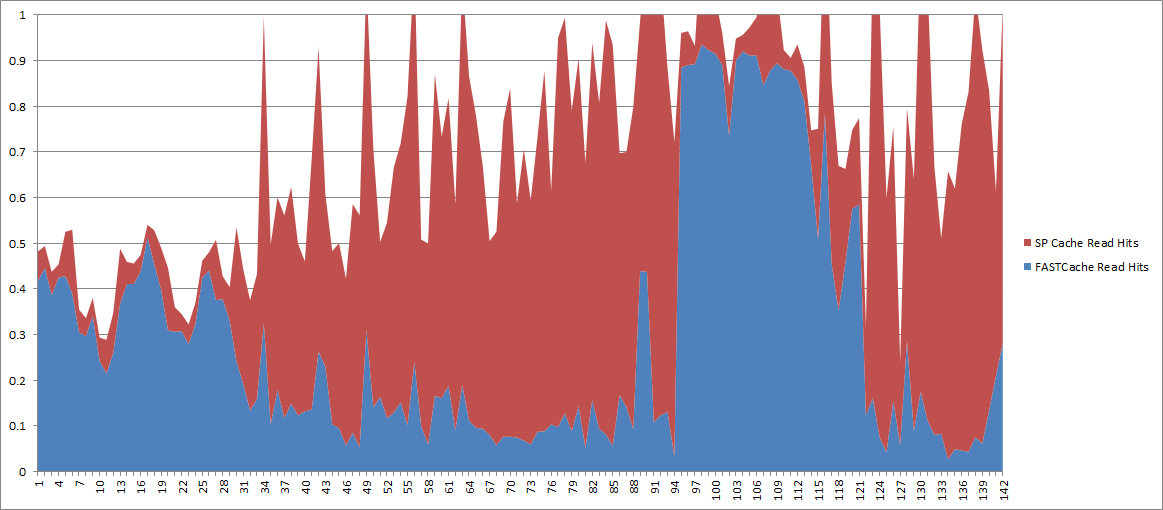
Hopefully this gives you a sense of what FASTCache could do for your Exchange environment, reducing backend disk workload for reads AND writes. I must reiterate, since an SP Cache hit is shown as a FASTCache miss, an 80% FASTCache hit ratio does not mean that 20% of the IOs are hitting disk. To illustrate this, I’ve graphed the sum of SP Cache Hits and FAST Cache Hits for a single database. You can see that in many cases we’re hitting a total of 100% cache hits.
Most interesting is the backup window where SP Cache is really handling a huge amount of the load. This is actually due to the Prefetch algorithms kicking in for the sequential read profile of a backup, something CX/VNX is very good at.

