Tag Archives: emc

Time flies when you’re having fun!

Posted on by

I can’t believe it’s already been a year and a half since my last post…  I’m sorry for the lack of content here.  Things have been so busy at EMC as well as at home and so much of what I’ve been working on is customer proprietary that I’ve had trouble thinking of ways to write about it.  In the meantime I’ve taken on a new role at EMC in the last month which will likely change what I’m thinking about as well as how I look at the storage industry and customer challenges.

In the past couple of years I’ve been involved in projects ranging from data lifecycle and business process optimization, storage array performance analysis, and scale out image and video repositories, to Enterprise deployments of OpenStack on EMC storage, Hadoop storage rationalization, and tools rationalization for capacity planning.  It is these last three items that have, in part, driven me into taking on a new role.

For the first three and half years I’ve spent at EMC I’ve been an Enterprise Account Systems Engineer in the Pacific Northwest.  Technically, I was first hired into the TME (Telco/Media/Entertainment) division focused on a small set (12 at first) of accounts near Seattle.  After about a year of that, the TME division was merged into the Enterprise West division covering pretty much all large accounts in the area, but the specific customers I focused on stayed the same.  For the past year or so I’ve spent pretty much 80% of my time working with a very large and old (compared to other original DotCom’s) online travel company.  The rest of my time was spent with a handful of media companies.  I’ve learned A TON from my coworkers at EMC as well as my customers.  It’s amazing how much talent is lurking in the hallways of anonymous black glass buildings around Seattle, and EMC stands out as having the highest percentage of type-A geniuses (does that exist) of any place I’ve worked.

One of the projects I’ve been working on for a customer of mine is related to capacity planning.  As you may know, EMC has several software products (some old, some new, some mired in history) dedicated to the task of reporting on a customer’s storage environment.  These software products all now fall under the management of a dedicated division within EMC called ASD (Advanced Software Division).  Over the past 13 years, EMC has acquired and integrated dozens of software companies and for a long time these software products were all point solutions that, when viewed as a set, covered pretty much every infrastructure management need imaginable.  But they were separate products.  In the past couple years alone massive progress has been made towards integrating them into a cohesive package that is much better aligned and easier to consume and use.

In just the past 12 months, one acquisition specifically, has greatly contributed to EMC’s recent, and I’ll say future, success in the management tools sector, and that is Watch4Net.  More accurately the product was APG (Advanced Performance Grapher) from a company called Watch4Net, but now it is the flagship component of EMC’s Storage Resource Management (SRM) Suite.

I’ve been spending a lot of time with SRM Suite lately at several customer sites and I’m really quite impressed.  SRM Suite is NOT ECC (for those of you who know and love AND hate ECC), and it’s not ProSphere, or even what ProSphere promised; it’s better, it’s easier to deploy, it’s easier to navigate, it’s MUCH faster to navigate, it’s easier to customize (even without Professional Services), it’s massively extensible, and it works today!  The Watch4Net software component is really a framework for collection, data storage, and presentation of data, and it includes dozens of Solution Packs (combinations of collector plug-ins and canned reports for specific products).  And more Solution Packs are coming out all the time, and you can even make your own if you want to.

What I really like about SRM Suite is the UI that came from Watch4Net.  It’s browser based (yes it supports IE, Chrome, Firefox, Mac, PC, etc) and you can easily create your own custom views from the canned reports.  You can even combine individual components (ie: graphs or tables) from within different canned reports into a single custom view.  And any view you can create, you can schedule as an emailed, FTP’d, or stored report with 2 clicks.  Have an extremely complex report that takes a while to generate?  Schedule it to be pre-generated at specific times during the day for use within the GUI, again with 2 clicks.

As slick as the GUI is, the magic of SRM Suite comes from the collectors and reports that are included for the various parts of your infrastructure.  There are SolutionPacks for EMC and non-EMC storage arrays, multiple vendor FibreChannel switches, Cisco, HP, IBM servers, IP network switches and routers, VMware, Hyper-V, Oracle, SQL, MySQL, Frame-Relay, MPLS, Cisco WiFi networks, and many more.  This single tool provides drill down metrics on individual ports of a SAN switch for a Storage Engineer, Capacity forecasting for management, as well as rollup health dashboards for your company’s executives all within the same tool.  And those same Exec’s can get their reports on their iPhones and iPads with the Watch4Net APG iOS app anywhere they happen to be.

(From vTexan’s post about SRM)

It’s hard to paint the picture in words or even a few screenshots, so you should ask your local EMC SE for a demo!

The second Big Deal coming from EMC’s ASD division is EMC ViPR.  ViPR is EMC’s Software Defined Storage solution.  ViPR abstracts and virtualizes your SAN, NAS, Object, and Commodity storage into Virtual Pools and automates the provisioning process from LUN/FileSystem creation to masking, zoning, and host attach, all with Service Level definitions, Business Unit and Project role-based access, and built in chargeback/showback reporting.  A full web portal for self-service is included as well as a CLI but the real power is the fully capable REST API which allows your existing automation tools to issue requests to ViPR, to handle end-to-end provisioning of your entire environment.  Best of all ViPR has open APIs and supports heterogenous (ie: EMC and non-EMC storage) allowing you to extend the single ViPR REST API to all of your disparate storage solutions.

Looking at the future of the storage industry, as well as EMC as a company, I see ViPR, in combination with SRM Suite, as the place to be for the next few years at least.  And so that’s what I’m doing.  Right now I’m in the process of transitioning from my Account SE role into being one of just a handful of ASD Software Specialist SE’s (sometimes also referred to as SDSpecialists).  In my new roll I’ll be the local Specialist for SRM Suite, ViPR, Service Assurance Suite (aka EMC Smarts), and several other EMC products you probably never thought of as software, or probably never heard of.  There are many enhancements to all of the products on the near term roadmap which will further solidify the ASD software portfolio as market leading but I can’t talk to much about that here..  So ask your local EMC SE to set up a roadmap discussion at the same time as the demo you already asked for.

I do plan to get to writing more often again, and I believe that my new role in the ASD organization will provide good content for that.

More soon!

Building Blocks – Part VI: But my #PrivateCloud is too small (or too big) for building blocks!

Posted on by

Does your Building Block need a Fabric? <- Part 6

Okay, so this is all well and good, but you have been reading these posts and thinking that your environment is nowhere near the size of my example so Building Blocks are not for you. The fact is you can make individual Building Blocks quite a bit smaller or larger than the example I used in these posts and I’ll use a couple more quick examples to illustrate.

Small Environment: In this example, we’ll break down a 150 VM environment into three Building Blocks to provide the availability benefit of multiple isolated blocks. Additional Building Blocks can be deployed as the environment grows.

150 Total VMs deployed over 12 months
(2 vCPUs/32GB Disk/1GB RAM/25 IOPS per VM)

    • 300 vCPUs
    • 150GB RAM
    • 4800 GB Disk Space
    • 3750 Host IOPS

Assuming 3 Building Blocks, each Building Block would look something like this:

    • 50 VMs per Building Block
    • 2 x Dual CPU – 6 Core Servers (Maintains the 4:1 vCPU to Physical thread ratio)
    • 24-32GB RAM per server
    • 19 x 300GB 10K disks in RAID10 (including spares) — any VNXe or VNX model will be fine for this
      • >1600GB Usable disk space (this disk config provides more disk space and performance than required)
      • >1250 Host IOPS

Very Large Environment: In this example, we’ll scale up to 45,000 VMs using sixteen Building Blocks to provide the availability benefit of multiple isolated blocks. Additional Building Blocks can be deployed as the environment grows.

45000 Total VMs deployed over 48 months
(2 vCPUs/32GB Disk/4GB RAM/50 IOPS per VM)

    • 90000 vCPUs
    • 180,000 GB RAM
    • 1,440,000 GB Disk Space
    • 2,250,000 Host IOPS

Assuming 4 Building blocks per year, each Building Block would look something like this:

    • 2812 VMs per Building Block
    • 18 x Quad CPU – 10 Core Servera plus Hyperthreading (Maintains the 4:1 vCPU to Physical thread ratio)
    • 640GB Ram per server
    • 1216 x 300GB 15K disks in RAID10 (including spares) — one EMC Symmetrix VMAX for each Building Block
      • >90000GB Usable disk space (the 300GB disks are the smallest available but still too big and will provide quite a bit more space than the 90TB required. This would be a good candidate for EMC FASTVP sub-LUN tiering along with a few SSD disks, which would likely reduce the overall cost)
      • >140,000 Host IOPS

Hopefully this series of posts have shown that the Building Block approach is very flexible and can be adapted to fit a variety of different environments. Customers with environments ranging from very small to very large can tune individual Building Block designs for their needs to gain the advantages of isolated, repeatable deployments, and better long term use of capital.

Finally, if you find the benefits of the Building Block approach appealing, but would rather not deal with the integration of each Building Block, talk with a VCE representative about VBlock which provides all of the benefits I’ve discussed but in a pre-integrated, plug-and-play product with a single support organization supporting the entire solution.

Does your Building Block need a Fabric? <- Part 6

Building Blocks – Part V: Does your #PrivateCloud building block need a fabric?

Posted on by

Sizing your Building Block <- Part 5 -> I’m too small for Building Blocks

You may have noticed in the last installment that I did not include any FibreChannel switches in the example BOM. There are essentially three ways to deal with the SAN connectivity in a Building Block and there are advantages as well as disadvantages to each. (Note: this applies to iSCSI as well)

1.) Use switches that already exist in your datacenter: You can attach each storage array and each server back to a common fabric that you already have (or that you build as part of the project) and zone each of the Building Block’s servers to their respective storage array.

  • Advantages:
    • Leverage any existing fabric equipment to reduce costs and centralize management
    • Allow for additional servers to be added to each Building Block in the future
    • Allow for presenting storage from one Building Block to servers in a different Building Block (useful for migrations)
  • Disadvantages:
    • Increases complexity – Requires you to configure zoning within each Building Block during deployment
    • Increases chances for human error that could cause an outage – Accidentally deleting entire Zonesets or VSANs is not as uncommon as you might think
    • Reduces the availability isolation between Building Blocks – The fabric itself becomes a point-of-failure common to all Building Blocks.

2.) Deploy a dedicated fabric within each Building Block: Since each Building Block has a known quantity of storage and server ports, you can easily add a dual-switch/fabric into the design. In our example of 9 hosts you’d need a total of 18 ports for hosts and maybe 8 ports for the storage array for a combined total of 26 switch ports. Two 16-port switches can easily accommodate that requirement.

  • Advantages:
    • Depending on the switches used, it could allow for additional servers in each Building Block in the future
    • Allow for presenting storage from one Building Block to servers in a different building block (useful for migrations) by connecting ISLs between Building Blocks
    • Maintains the Building Block isolation by not sharing the fabric switches across Building Blocks.
  • Disadvantages:
    • Increases complexity – Requires you to configure zoning within each Building Block during deployment
    • Increases chances for human error that could cause an outage – Again, accidentally deleting entire Zonesets or VSANs is not as uncommon as you might think

3.) Dispense with the fabric entirely: Since Building Blocks are relatively small, resulting in fewer total initiator/target pairs, it’s possible in some cases to directly attach all of the hosts to the storage array. In our example, the nine hosts need eighteen ports and the VNX5700 supports up to twenty four FC ports. This means you can directly attach all of the hosts to the array and still have six remaining ports on the array for replication, etc. Different arrays from EMC as well as other vendors will have various limits on the number of FC ports supported. Also, not all vendors support direct attached hosts so you’ll need to check that with your storage vendor of choice to be sure.

  • Advantages:
    • Maintains the Building Block isolation by not sharing the fabric switches across Building Blocks.
    • Simplifies deployment by eliminating the need to do any zoning at all and effectively eliminates any port queue limits (HBA elevator depth settings)
    • Simplifies troubleshooting by eliminating the fabric (buffer to buffer credits, bandwidth, port errors, etc) from the IO path.
  • Disadvantages:
    • Limits the number of hosts per Building Block by the maximum number of ports supported by the storage array.
    • More difficult to non-disruptively migrate VMs between Building Blocks since storage cannot be shared across. (If all Building Blocks are in the same Virtual Data Center in VMWare vSphere, you can still live-migrate VMs via the IP network between Building Blocks using Storage vMotion)

If you decide that the host count limit is okay, and either non-disruptive migration between Building Blocks is unnecessary or Storage vMotion will work for you, then eliminating the fabric can reduce cost and complexity, while improving overall availability and time to deploy. If you need the flexibility of a fabric, I personally like using dedicated switches in each building block. Cisco and Brocade both offer 1U switches with up to 48 ports per switch that will work quite well. Always deploy two switches (as two fabrics) in each Building Block for redundancy.

Okay, so you’ve managed to calculate the size of your environment, how much time it will take you to virtualize it, the number of Building Blocks you need, and the specifications for each Building Block, including whether you need a fabric. Now you can submit your budget, get your final quotes, and place orders. Once the equipment arrives it’s time to implement the solution.

When your first Building Block arrives, it would be a valuable use of time to learn how to script the configuration for each component in the Building Block. An EMC VNX array can be completely configured using Naviseccli or PowerShell, from the Storage Pool and LUN provisioning to initiator registration and Host/LUN masking. VMWare vSphere can similarly be configured using scripts or PowerShell. If you take the time to develop and test your scripts against your first Building Block, then you can use those scripts to quickly stand up each additional Building Block you deploy. Since future Building Blocks will be nearly identical, if not entirely identical, the scripts can speed your deployment time immensely.

EMC Navisphere/Unisphere CLI (for VNX) is documented fully in the VNX Command Line Interface (CLI) Reference for Block 1.0 A02. This document is available on EMC PowerLink at the following location:

Home > Support > Technical Documentation and Advisories > Software ~ J-O ~ Documentation > Navisphere Management Suite > Maintenance/Administration

Be sure to leverage any storage vendor plug-ins available to you for your chosen hypervisor (VMWare, Hyper-V, etc) to improve visibility up and down the layers and reduce the number of management tools you need to use on a daily basis.

For example, EMC Unisphere Manager, the array management UI running on the VNX storage array, includes built-in integration with VMWare and other host operating systems. Unisphere Manager displays the VMFS datastores, RDMs, and VMs that are running on each LUN and a storage administrator can quickly search for VM names to help with management and/or troubleshooting tasks.

EMC also provides free downloadable plug-ins for VMWare vSphere and Hyper-V so server administrators can see what storage arrays and LUNs are behind their VMs and datastores. The plug-ins also allow administrators to provision new LUNs from the storage array through the plug-ins without needing access to the array management tools.

Depending on which storage vendor you choose, if you build a fabric-less Building Block, you may be able to do all of your server and storage administration from vCenter if you leverage the free plug-ins.

Sizing your Building Block <- Part 5 -> I’m too small for Building Blocks

Building Blocks – Part IV: Sizing Your #PrivateCloud Building Blocks

Posted on by

How many Building Blocks? <- Part 4 -> Does your Building Block need a Fabric?

Now that we know we’ll be deploying about 562 VM’s per Building Block we can use the other metrics to determine the requirements for a single block.

  • Since 562 VMs is about 12.5% of the 4500 total VMs, we then calculate 12.5% of the other metrics determined in the last post.
    • 12.5% of 9000 vCPUs = 1125 vCPUs
    • 12.5% of 4500GB RAM = 562GB RAM
    • 12.5% of 225,000 IOPS = 28125 Host IOPS
    • 12.5% of 562TB = 70TB Usable Disk capacity

First we’ll size the compute layer of the Building Block

  • At 4:1 vCPUs per Physical CPU thread you’d want somewhere around 281 hardware threads per Building Block. Using 4-socket, 8-core servers (32 cores per server) you’d need about 9 physical servers per building block. The number of vCPUs per physical CPU thread affects the % CPU Ready time in VMWare vSphere/ESX environments.
  • For 562GB of total RAM per Building Block, each server needs about 64GB of RAM
  • Per standard best practices, a highly available server needs two HBAs, more than two can be advantageous with high IOPS loads.

Next, we’ll calculate the storage layer of the Building Block

  • Assuming no cache hits, the backend disk load for 28,125 Host IOPS @ 50:50 read/write looks like the following:
    • RAID10 : 28125/2 + 28125/2*2 = 42187 Disk IOPS
    • RAID5 : 28125/2 + 28125/2*4 = 70312 Disk IOPS
    • RAID6 : 28125/2 + 28125/2*6 = 98437 Disk IOPS
  • If you calculate the number of disks required to meet the 70TB Usable in each RAID level, and the # of disks needed for both 10K RPM and 15K RPM disks to meet the IOPS for each RAID level, you’ll eventually find that for this specific example, using EMC Best Practices, 600GB 10K RPM SAS disks in RAID10 provides the least cost option (317 disks including hot spares). Since 10K RPM disks are also available in 2.5” sizes for some storage systems, this also provides the most compact solution in many cases (29 Rack Units for an EMC VNX storage array that has this configuration). In reality this is a very conservative configuration that ignores the benefits of storage array caching technologies and any other optimizations available, it’s essentially a worst case scenario and it would be beneficial to work with your storage vendor’s performance group to perform a more intelligent modeling of your workload.
  • Finally, you’ll need to select a storage array model that meets the requirements. Within EMC’s portfolio, 317 disks necessitate an EMC VNX5700 which will also have more than enough CPU horsepower to handle the 28125 host IOPS requirement.

At this point you’ve determined the basic requirements for a single Building Block which you can use as a starting point to work with your vendors for further tuning and pricing. Your vendors may also propose various optimizations that can help save you money and/or improve performance such as block-level tiering or extended SSD/Flash based caching.

Example bill-of-materials (BOM):

  • 9 x Quad-CPU/8-Core servers w/64GB RAM each
  • 2 x Single port FibreChannel HBAs
  • 1 x EMC VNX5700 Storage Array with 317 x 300GB 2.5” 10K SAS disks

Wait, where’s the fabric?

How many Building Blocks? <- Part 4 -> Does your Building Block need a Fabric?

Building Blocks – Part III: How Many Building Blocks does your #PrivateCloud need?

Posted on by

The Building Block Approach <- Part 3 -> Sizing your Building Block

The key to sizing Building Blocks is to calculate the ratio between the compute and storage metrics. First you need to take a look at the total performance and disk space requirements for the whole environment, similar to the below example:

  • Total # of Virtual Machines you expect to be hosting (example: 4500 VMs)
  • Total Virtual CPUs assigned to all Guest VMs (average of 2 vCPUs per VM = 9000 vCPUs)
  • Total Memory required across all Guest VMs (average of 1GB per VM = 4.5TB)
  • Total Host IOPS needed at the array for all Guest VMs (average of 50 IOPS per VM = 225,000 Host IOPS)
    • You will need to have a read/write ratio with this as well (we will use 50:50 for these examples)
  • Total Disk Storage required for all Guest VMs. (average of 125GB per VM = 562TB)

Once you have the above data, you need to decide how many Building Blocks you want to have once the entire environment is built out. There are several things to consider in determining this number:

  • How often you want to be deploying additional Building Blocks (more on this below)
  • Your annual budget (I’m ignoring budget for this example, but your budget may limit the size of your deployment each year)
  • How many VMs you think you can deploy in a year (we’ll use 2250 per year for a two year deployment)

Some of these are pretty subjective so your actual results will vary quite a bit, but based what I’ve seen I do have some recommendations.

  • In order to take advantage of the availability isolation inherent in the Building Block approach, you’ll want to start with at least two Building Blocks and then add them one or two at a time depending on how you want to spread your server farms across the infrastructure.
  • Depending on the size of each Building Block you may want to keep Building Block deployments down to one every 3-6 months. That gives you ample time to build each block correctly and hopefully leaves time between deployments to monitor and adjust the Building Blocks.

That said I’d lean toward 4 to 6 Building Blocks per year. Of course this is just my opinion and your mileage may vary. For our example of 4500 VMs over 2 years @ 4 Building Blocks per year. we’ll end up with 8 Building Blocks with about 562 VMs each.

The Building Block Approach <- Part 3 -> Sizing your Building Block

Building Blocks – Part II: The Building Block Approach to the #PrivateCloud

Posted on by

Build your own Private Cloud <- Part 2 -> How many Building Blocks

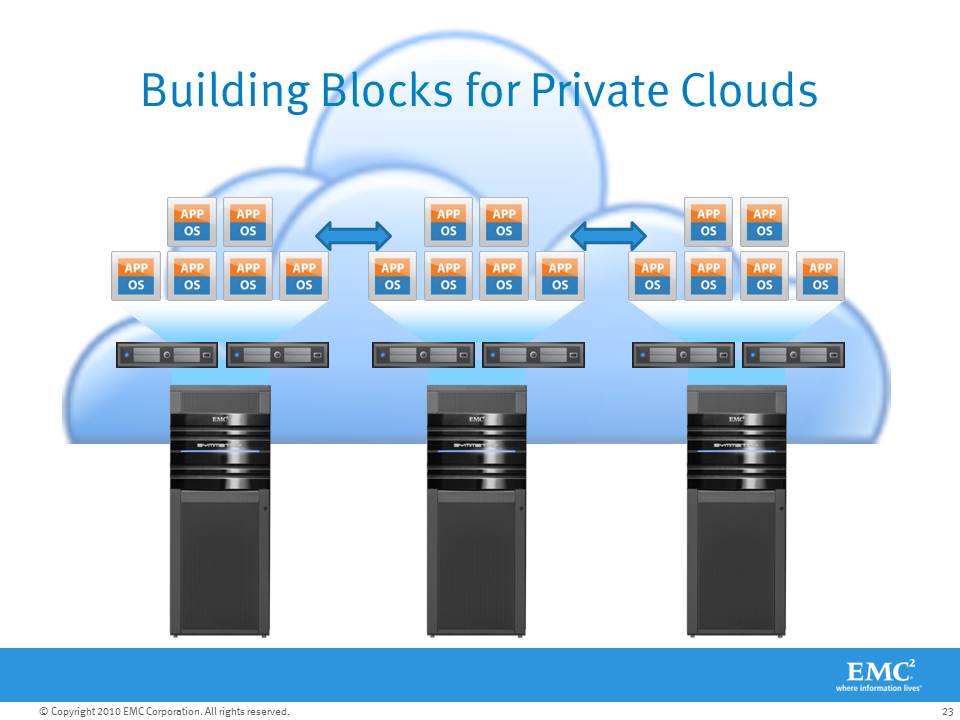
Since server virtualization abstracts the physical hardware from the operating systems and applications, essential for Cloud Infrastructures (also known as Infrastructure-as-a-Service), it’s ideally suited for breaking down the physical infrastructure into Building Blocks. Put simply, Building Blocks are repeatable, pre-designed mixes of storage, CPU, and memory.

There are several advantages to the Building Block approach that I’ll point out here:

  1. Rather than dropping a huge amount of capital up front on the entire infrastructure you need over the long haul, some of which will not be used at first, you can start with a smaller capital outlay today, then make multiple similarly small capital purchases only as needed. Further, when the hardware in a single Building Block reaches the end of its life (for any number of reasons), only that one Building Block will need to be refreshed at that time rather than a wholesale replacement of the entire environment.
  2. In an environment where virtualization is a new endeavor, sizing the compute, memory, and storage required is really an educated guess. As each Building Block is consumed, the real-world performance can be analyzed and adjusted for future Building Blocks to more closely match your specific workload.
  3. Building Blocks are inherently isolated which creates natural performance and availability boundaries. This can be leveraged for web and application server farms by spreading nodes of each farm across multiple Building Blocks. In the event of a catastrophic failure of one Building Block, due to major software bug affecting the cluster or the failure of an entire storage array for some reason, nodes of the server farm not hosted on the failed Building Block will be unaffected.
  4. The list price for storage arrays and servers goes down over time. If your growth is similar to many of my customers, where full build out of the physical infrastructure will not be required until 2-3 years after the start of the project, the acquisition cost of each individual Building Block will decrease over time, saving you money overall.
  5. In many cases, and due to a variety of factors, the cost to upgrade a storage array is higher than the cost to purchase the capacity with a new array. Upgrades also add complexity, complicate asset depreciation, and warranty renewals. The Building Block approach eliminates the majority of upgrades and the associated complexity.

Each Building Block can be maintained in its original build state or upgraded independent of the other building blocks so, for example, you don’t have to worry about upgrading every server in your datacenter with new HBA drivers if you decide to upgrade the storage array firmware on one array. You would only need to upgrade the servers in that arrays’ Building Block.

You may be thinking that your environment is not large enough to use a Building Block approach, but the more I worked on this project, the more I realized that Building Blocks can be adjusted to fit even very small environments. I’ll go into that a bit more later.

Build your own Private Cloud <- Part 2 -> How many Building Blocks

Building Blocks – Part I: Build your own #PrivateCloud

Posted on by

Part 1 -> The Building Block Approach

As 2011 wraps up and I have a little time at home over the holidays, I’ve been reflecting on some of the customer projects I’ve worked on over the past year. Cloud computing and EMC’s vision for the “Journey to the Private Cloud” have been hot topics this year and of the various projects I’ve worked on this past year, one stands out to me as something that could be used as a blueprint for others who want to deploy their own Private Cloud but may not know how to start.

I have been working with a customer with approximately 10,000 servers that support their business and for all intents had zero virtualization as recent as 2010.  As most customers already know, they thought it would be good to begin virtualizing their environment to drive up asset utilization and flexibility while bringing down costs.  In the past, they’ve experimented with multiple server virtualization solutions (such as VMWare ESX and Microsoft Hyper-V) with limited success and had all but abandoned the idea.  A change in leadership in late 2010 brought a top-down initiative to virtualize wherever possible, but in order to instill confidence in virtualized environments within the various business units, the virtual infrastructure needed to be reliable and performant.

The customer spent the latter half of 2010 looking at their existing physical environment, finding that about 80% of the 10,000 servers were various application, file, and web servers; the remaining 20% being various database servers (mostly MS SQL).  Moving an infrastructure this large into a Private Cloud model would take several years and, further adding to the challenge, the DBA teams were particularly wary about virtualizing their database servers.  That said, the newly formed Virtualization and Cloud team set a goal of virtualizing the approximately 8,000 non-database servers over 36 months, starting out with dev/test and gradually adding production and tier-1 applications until only the database servers remained on physical infrastructure.  They believe that if they prove success with virtualization during this first 3 years, the DBAs will be more willing to begin virtualizing their systems, plus there should be more knowledge and tools in the public domain for managing virtual database instances by then.

To accomplish all of their goals, the customer leveraged some experience that individual team members had gained from prior environments to come up with a Building Block based deployment.  I worked with them to finalize the design and sizing for the each Building Block and throughout the year have helped analyze the performance of the deployed infrastructure to help determine how the Building Blocks can be optimized further.  Through the next several posts, I will explain the Building Block approach, detailing the benefits, some of the considerations, and some thoughts around sizing.  I hope that this information will be useful to others.  The content is mostly vendor agnostic except for some example data that uses EMC specific storage best practices.

Part 1 -> The Building Block Approach

Does EMC FASTCache work with Exchange?

Posted on by

Short Answer: Yes!

In my dealings with customers I’ve been requesting performance data from their storage systems whenever I can to see how different applications and environments react to new features. Today I’m going to give you some more real-world data, straight from a customer’s production EMC NS480.

I’ve pulled various stats out of Analyzer for this customer’s Exchange server, which has 3 mail databases totaling about 1TB of mail stored on the NS480 via FibreChannel connect. Since this customer is not extremely large (similar to most of our customers) they are using this NS480 for pretty much everything from VMWare, SQL, and Exchange, to NAS, web/app content, and Business Intelligence systems. There is about 30TB of block data and another 100TB of NAS data. FASTCache is enabled for all LUNs and Pools with just 183GB of usable FASTCache space (4 x 100GB SSDs). So in this environment, with a modest amount of FASTCache and very mixed workload, how does Exchange fare?

Let’s first take a look at the Exchange workload itself for a 24 hour period: (Note: There were no reads from the Exchange log LUNs to speak of so I left that out of this analysis.)

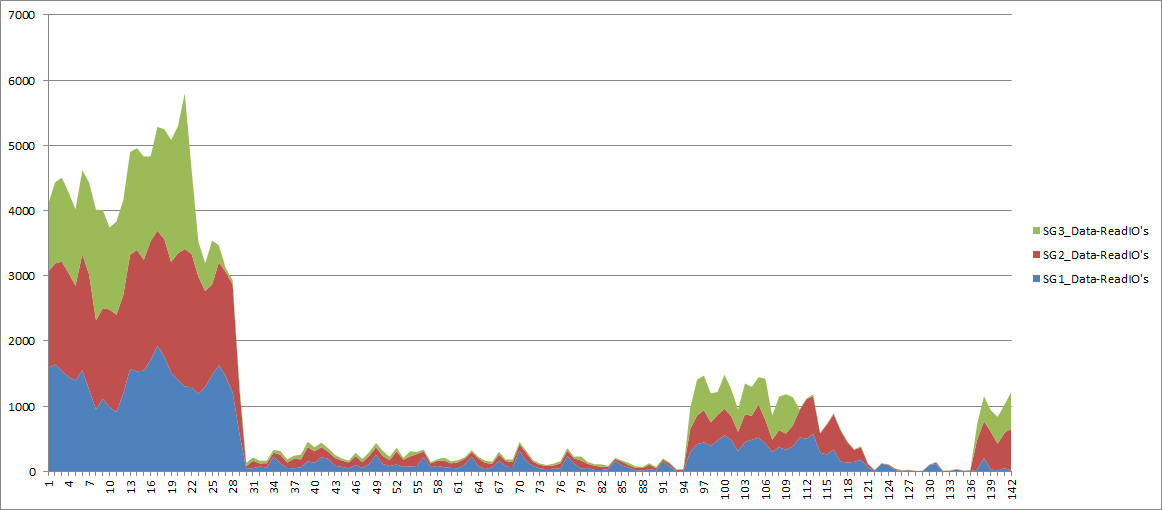
Total Read IOPS for the 3 databases: (the largest peak is a result of database maintenance jobs and the smaller peaks are due to backup jobs) Here it’s tough to see due to the maintenance and backup peaks, but production IO during the work day is about 200-400IOPS. By the way, a source-deduplicating incremental-forever backup technology, such as Avamar, could drastically reduce the IO Load and duration of the nightly backup

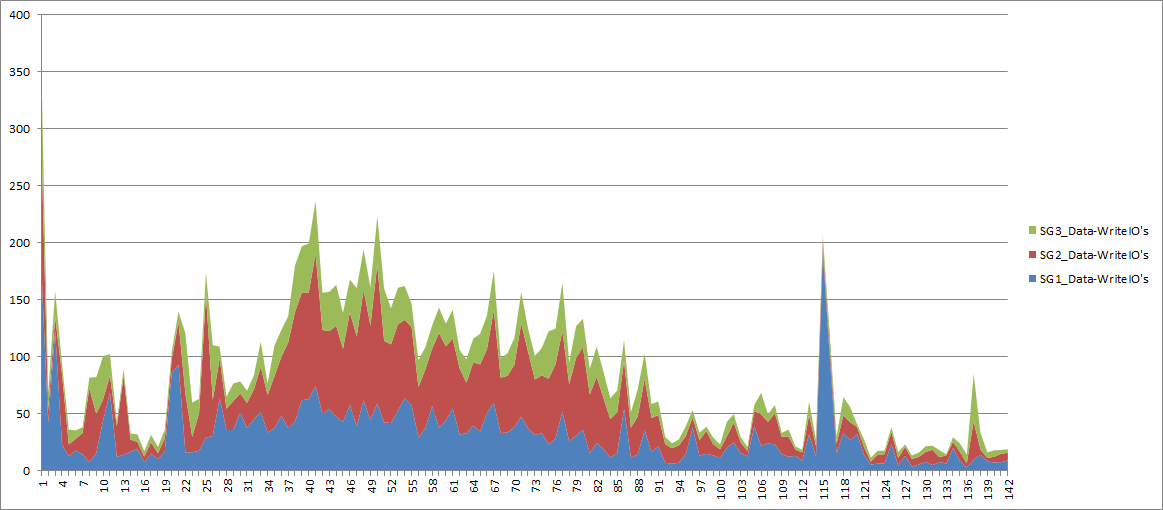
Total Write IOPS for the 3 databases: Obviously more changes to the database occurring during the work day.

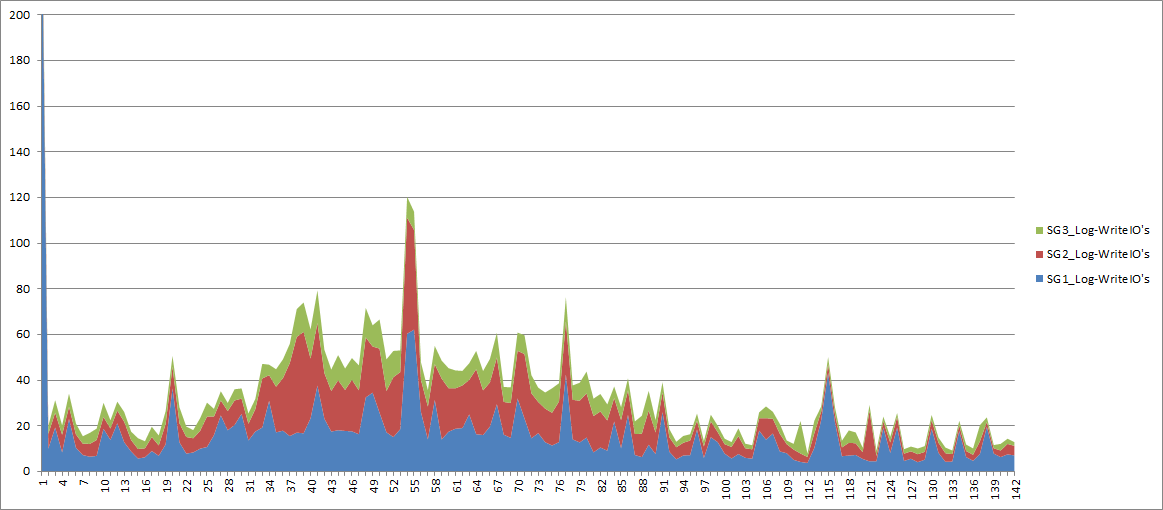
Total Write IOPS for the 3 Log files: Log data is typically cached easily in the SP cache so FAST Cache isn’t terribly required here but I’m including it to show whether there is any value to using FASTCache with Exchange logs.

Now let’s look at the FASTCache hit ratios for this same set of data: (average of all 3 DBs)

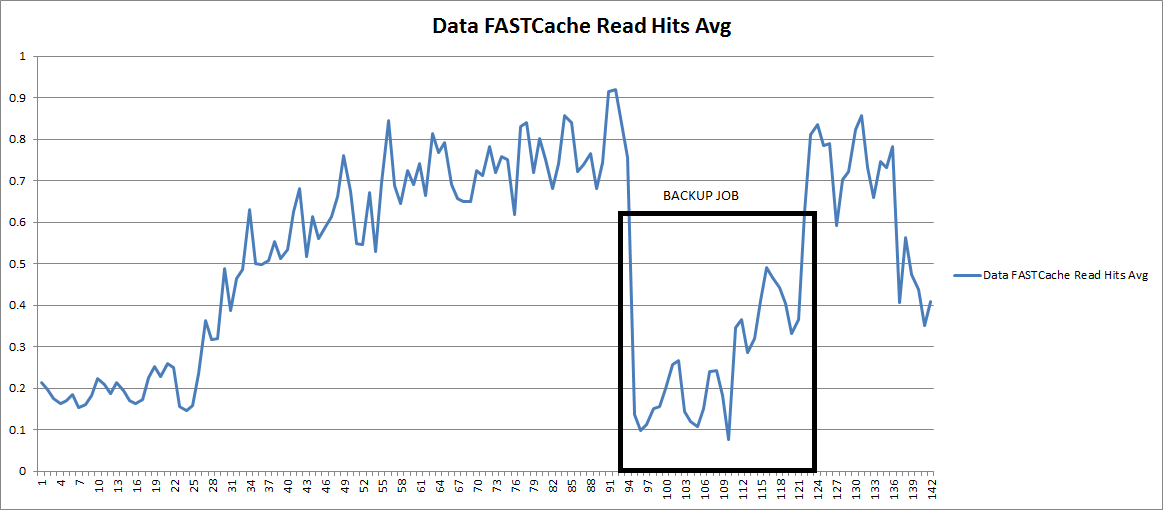
First, the Read Activity: Here you can see that aside from the maintenance and backup jobs, FASTCache is servicing 70-90% of the Read IOPs. Keep in mind that a FASTCache miss could still be a Cache Hit if the data is in SP Cache. What’s interesting about this is that it looks like the nightly maintenance job is pushing the highest load.

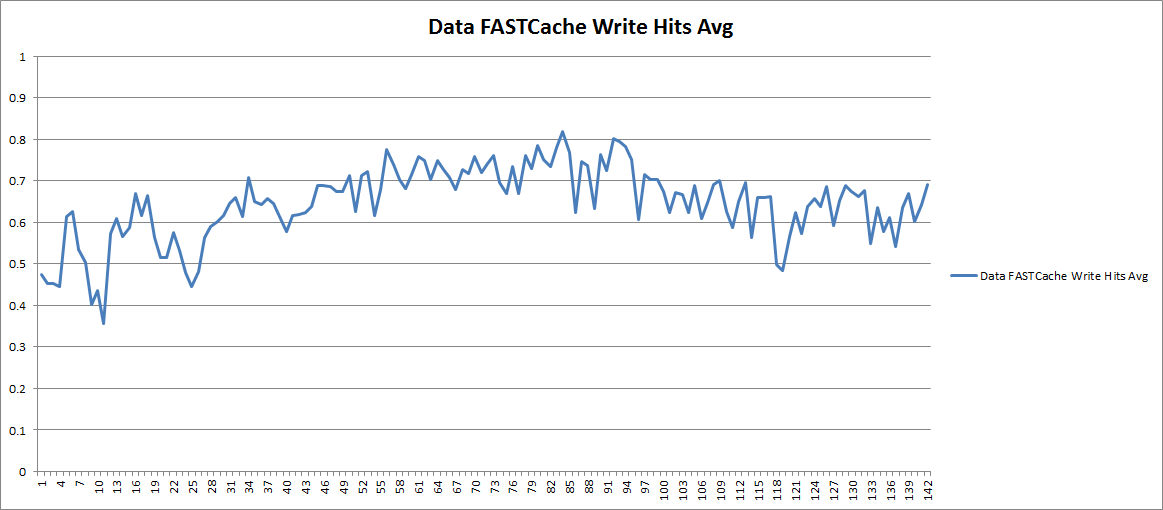
And the Write Activity: The beauty of EMC’s FASTCache implementation being a read/write cache, the benefit extends beyond just read IO. Here you see that FASTCache is servicing 60-80% of the writes for these Exchange Databases. That’s a huge load off the backend disks.

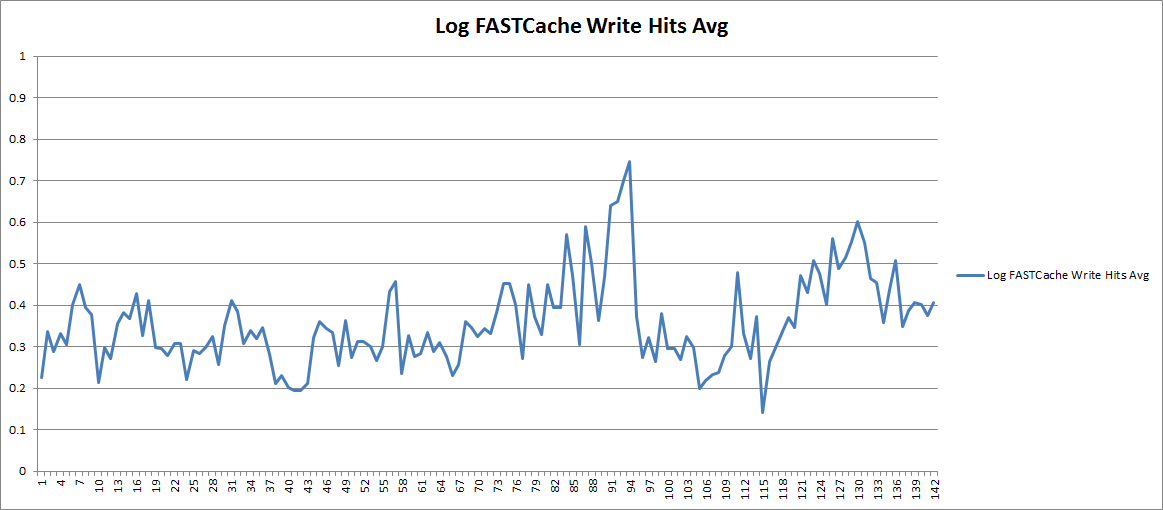
And the Log Writes: Since Log writes are usually not a performance problem, I would say that FASTCache is not necessary here, and the average 30% hit ratio shown here is not great. If you wanted to spend the time to tune FASTCache a bit, you might consider disabling FASTCache for Log LUNs to devote the FASTCache capacity to more cache friendly workloads.

All in all you can see that for the database data, FASTCache is servicing a significant portion of the user generated workload, reducing the backend disk load and improving overall performance.

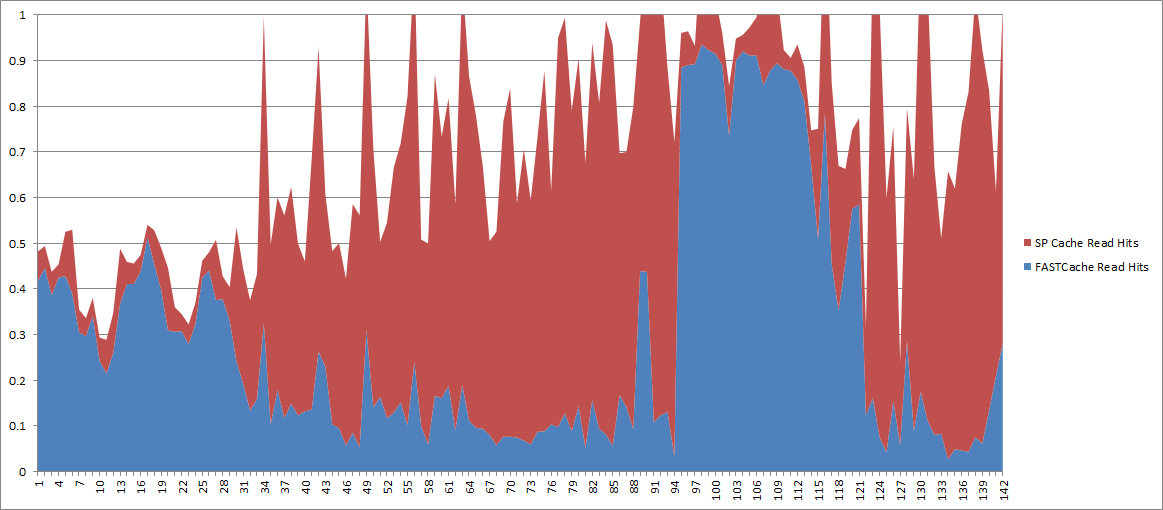
Hopefully this gives you a sense of what FASTCache could do for your Exchange environment, reducing backend disk workload for reads AND writes. I must reiterate, since an SP Cache hit is shown as a FASTCache miss, an 80% FASTCache hit ratio does not mean that 20% of the IOs are hitting disk. To illustrate this, I’ve graphed the sum of SP Cache Hits and FAST Cache Hits for a single database. You can see that in many cases we’re hitting a total of 100% cache hits.

Most interesting is the backup window where SP Cache is really handling a huge amount of the load. This is actually due to the Prefetch algorithms kicking in for the sequential read profile of a backup, something CX/VNX is very good at.

Find your busiest LUNs Fast with Unisphere Analyzer Search

Posted on by

One of the features that has been added to Analyzer (Navisphere and Unisphere) in recent versions is the ability to search for specific LUNs based on criteria.  This feature is actually pretty powerful because the criteria itself is pretty flexible.  For example, you can search for all LUNs attached to a specific host, or with a specific set of characters in the LUN name.  In addition you can search against performance metrics like Throughput, Response Time, or LUN Utilization.  This is where it gets interesting because you can look for poorly performing LUNs really quickly.  In the following example, I am going to build a search that looks for LUNs that have EX in the name (since all of my Exchange server LUNs have EX in the name) that ALSO have high LUN utilization for several polling intervals.

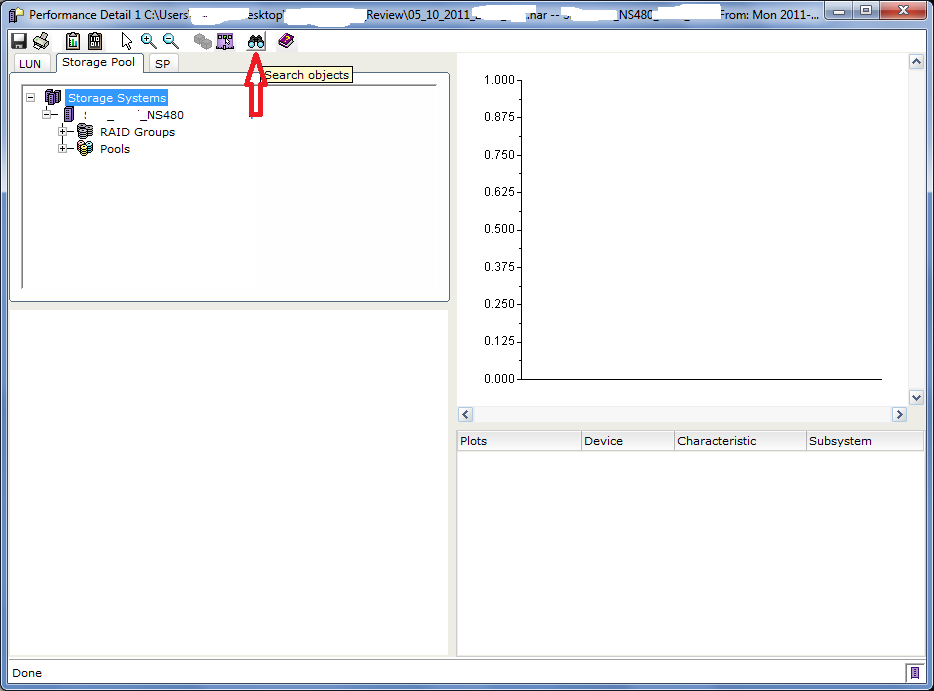
Once you’ve launched Analyzer and opened an Archive, click on the binocular icon in the tool bar to bring up the search dialog. 

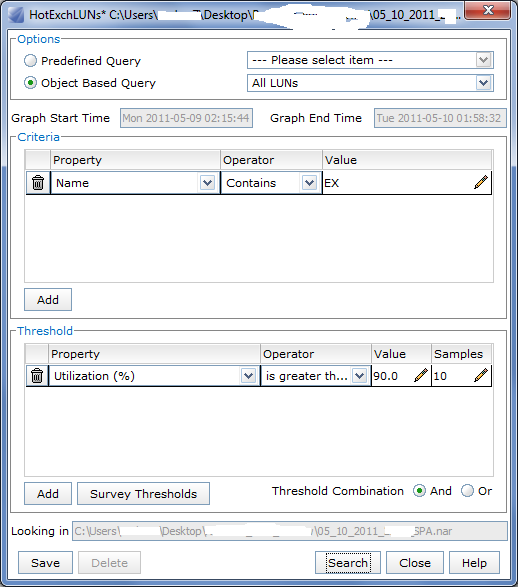
You can choose a predefined search (a search you previously created and saved) or a new Object Based Query.  In this example we are going to build a new query so select “Object Based Query” and choose All LUNs in the drop down box.  If you wanted, you could narrow down the search to just Pool Based LUNs, just MetaLUNs, or Component LUNs, etc.)

Next we’ll define the LUN criteria by selecting the Name property, choosing Contains, and entering the “EX” value.  This will filter the search to only those LUNs that have EX in the name.  Finally we’ll set a threshold.  In this example, I’m looking for LUNs that have a LUN Utilization value over greater than 90% for at least 10 polling samples.  I could add more LUN criteria and/or more thresholds to further narrow down the results with AND or OR combinations.

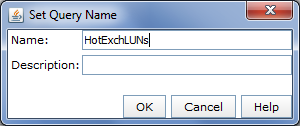
Optionally, you can save the query so that it will be listed in the “Predefined Query” list in the future.  Click Search and set or edit the name of the search.

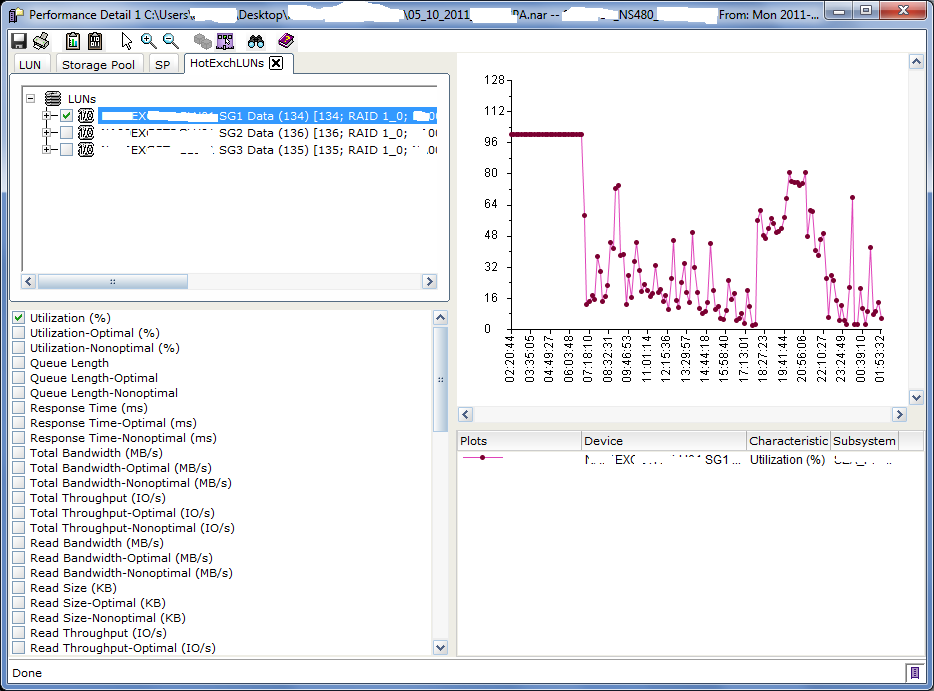
After clicking OK, Analyzer will create a new tab and populate the results of the search.  Once the search is complete you can graph metrics for the LUNs like normal.  Here I’ve selected Utilization to show why this LUN matched the search criteria — note the high utilization between 2am and 7am.

You can get much more granular with your searches if you are looking for something specific, or use metrics like Response Time to look for poorly performing LUNs attached to a specific server.  It’s pretty flexible.  I started using the search feature recently and thought others might be interested in it.  Try it out and let me know what you think.

Performance Analysis for Clariion and VNX – Part 5 (FASTCache)

Posted on by

<< Back to Part 4 — Part 5 — Go to Part 6 >>

Sorry for the delay on this next post..  Between EMC World and my 9 month old, it’s been a battle for time…

Okay, so you have an EMC Unified storage system (Clariion, Celerra, or VNX) with FASTCache and you’re wondering how FASTCache is helping you.  Today I’m going to walk you through how to tease FASTCache performance data out of Analyzer.

I’m assuming you already have Analyzer launched and opened a NAR archive.  One thing to understand about Analyzer stats as they relate to FASTCache, is that stats are gathered at the LUN level for traditional RAID Group LUNs, but for Pool based LUNs, the stats are gathered at the pool level.  As a result graphing data for FASTCache differs for the two scenarios.

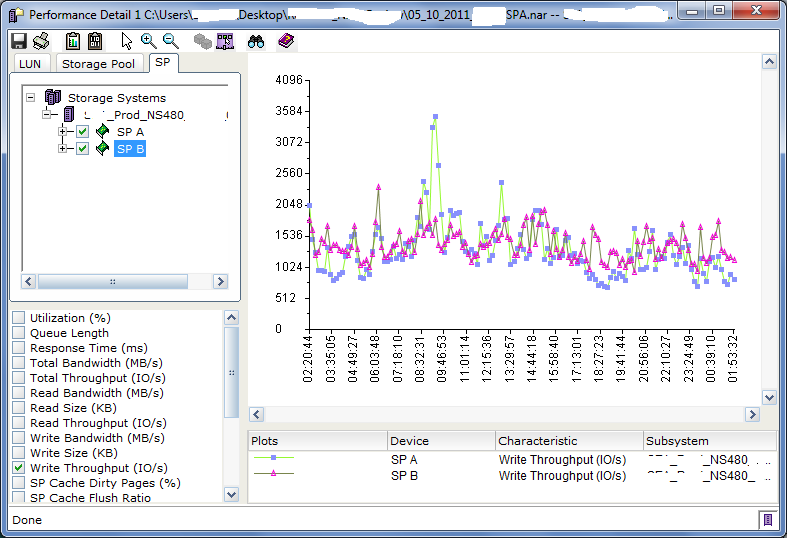
First we’ll take a look at the overall array performance.  Here we’ll see how much of the write workload is being handled by FASTCache.  In the SP Tab of Analyzer, select both SPs (be sure no LUNs or other objects are selected).  Select Write Throughput (IO/s), and then click the clipboard icon (with I’s and O’s).

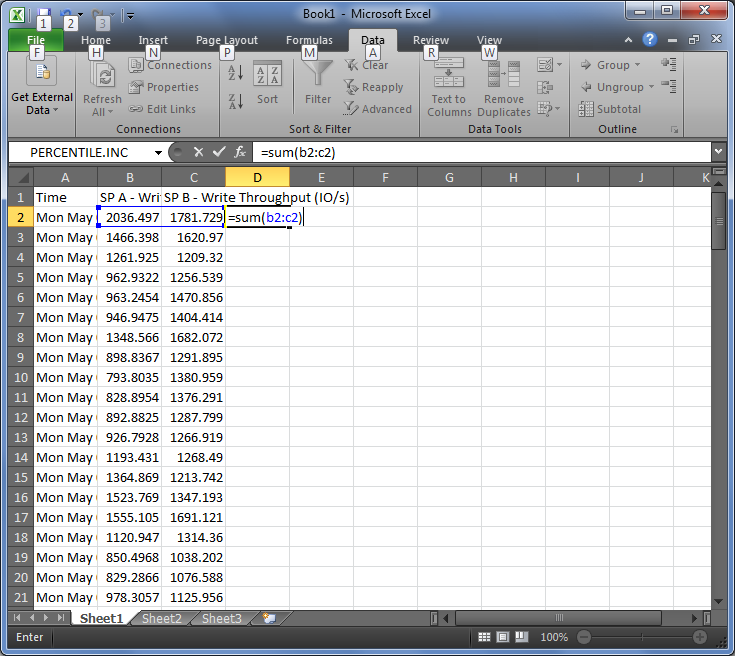
Launch Microsoft Excel and paste into the sheet, and then perform the text-to-column change discussed in the previous post if necessary.

Next create a formula in the D column, adding the values for both SPs into a single total.  We’re not going to graph it quite yet though.

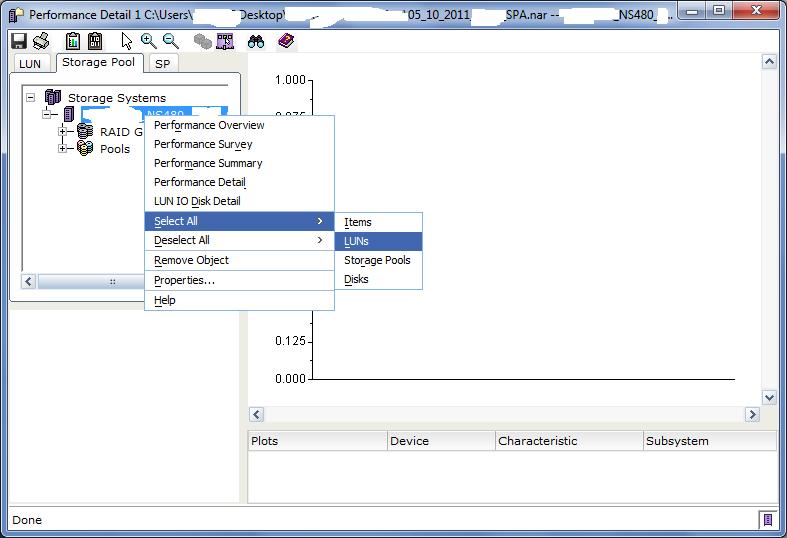
Back in Analyzer, deselect the two SPs, switch to the Storage Pool Tab, right-click on the array and choose Select All -> LUNs, then Select All -> Pools.

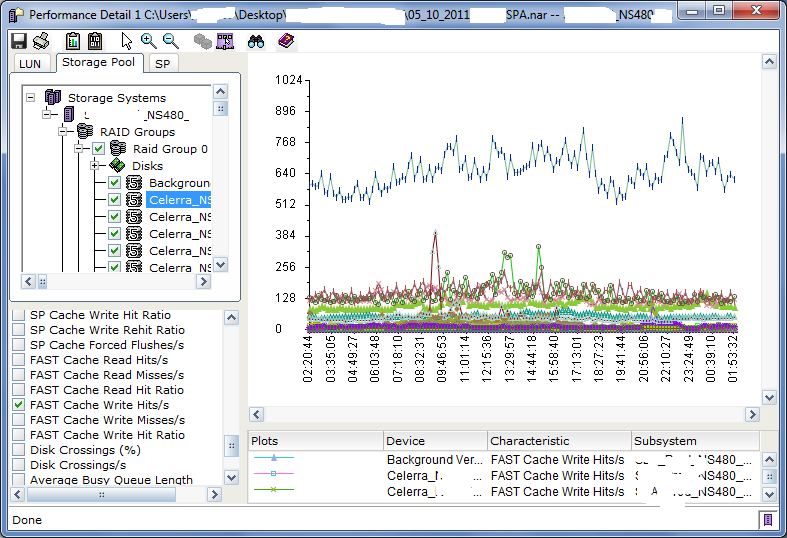
Click on a RAID Group LUN or Pool in the tree, it doesn’t matter which one, deselect Write Throughput (IO/s) and select FAST Cache Write Hits/s.  In a moment, you’ll end up with a graph like this.

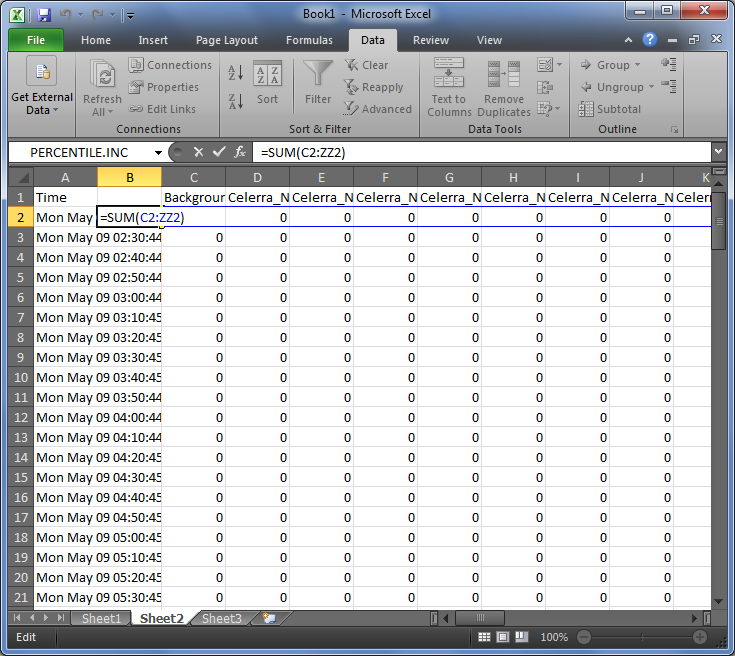
Click the clipboard icon again to copy this data and paste it into a new sheet of the same workbook in Excel.  Insert a blank column between column A and B, then create a formula to add the values from column B through ZZ (ie: =SUM(C2:ZZ2).

Then copy that formula and paste into every row of column B.  This column will be our Total FAST Cache Write Hits for the whole array.  Finally, click the header for Column B to select it, then copy (CTRL-C).  Back to the first sheet — Paste the “Values” (123 Icon) into Column E.

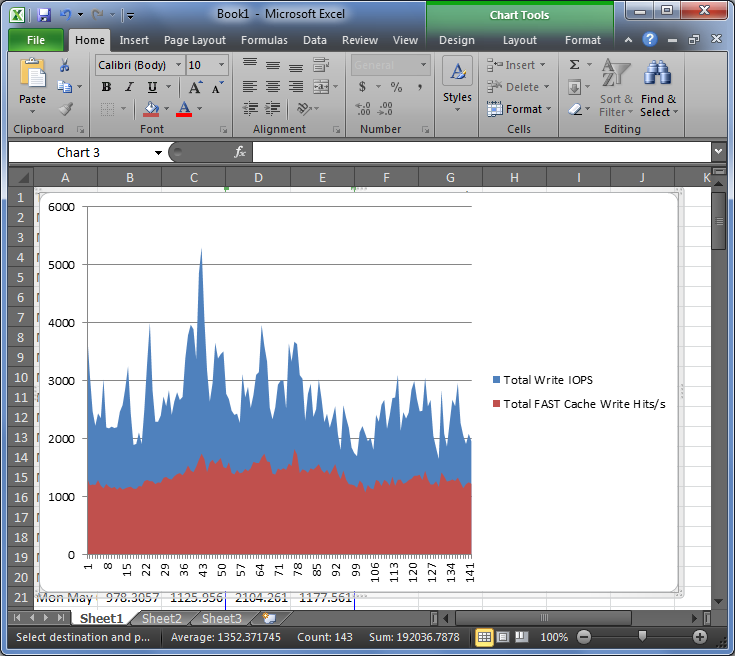
Now that we have the Total Write IOPS and Total FAST Cache Write Hits in adjacent columns of the same worksheet, we can graph them together.  Select both columns (D and E in my example), click Insert, and choose 2D Area Chart.  You’ll get a nice little graph that looks something like the following.

Since it’s a 2D Area Chart, and not a stacked graph, the FASTCache Write IOPS are layered over the Total Write IOPS such that visually it shows the portion of total IOPS handled by FASTCache.  Follow this same process again for Read Throughput and FASTCache Read Hits.  Furthur manipulation in Excel will allow you to look at total IOPS (read and write) or drill down to individual Pools or RAID Group LUNs.

Another thing to note when looking at FASTCache stats…  FAST Cache Misses are IOPS that were not handled by FASTCache, but they may still have been handled by SP Cache.  So in order to get a feel for how many read IOs are actually hitting the disks, you’d actually want to subtract SP Read Cache Hits and Total FASTCache Read Hits (calculated similar to the above example) from SP Read Throughput.  This is similar for Write Cache Misses as well.

I hope this helps you better understand your FASTCache workload.  I’ll be working on FASTVP next, which is quite a bit more involved.

<< Back to Part 4 — Part 5 — Go to Part 6 >>