<< Back to Part 3 — Part 4 — Go to Part 5 >>
Making Lemonade from Lemons.
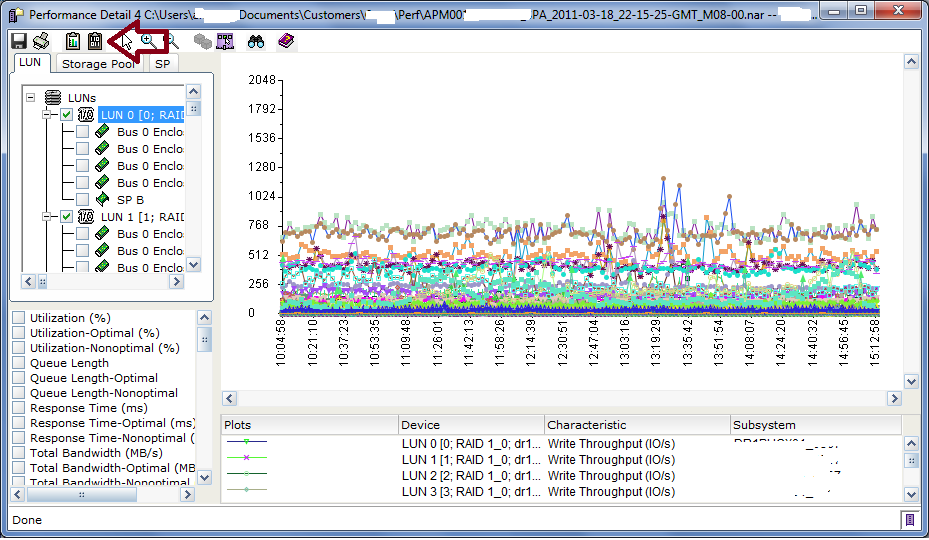
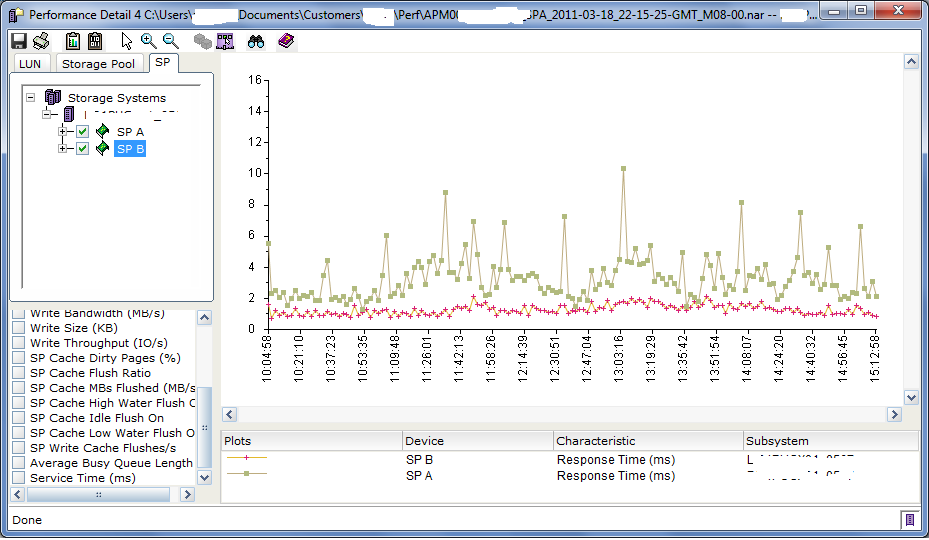
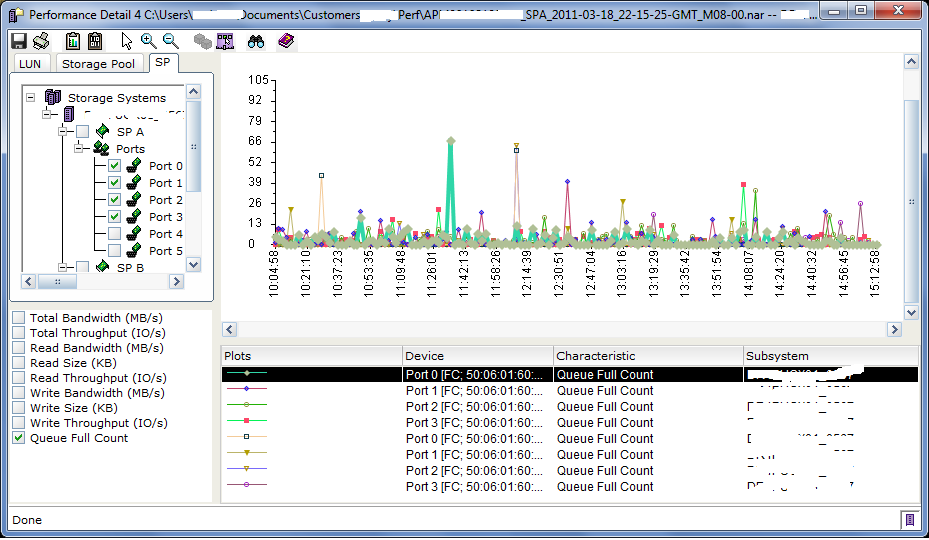
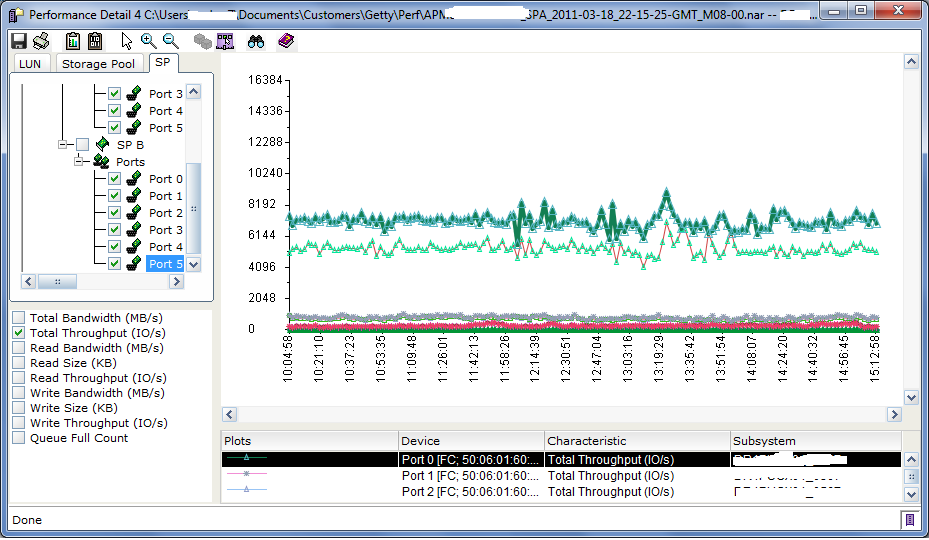
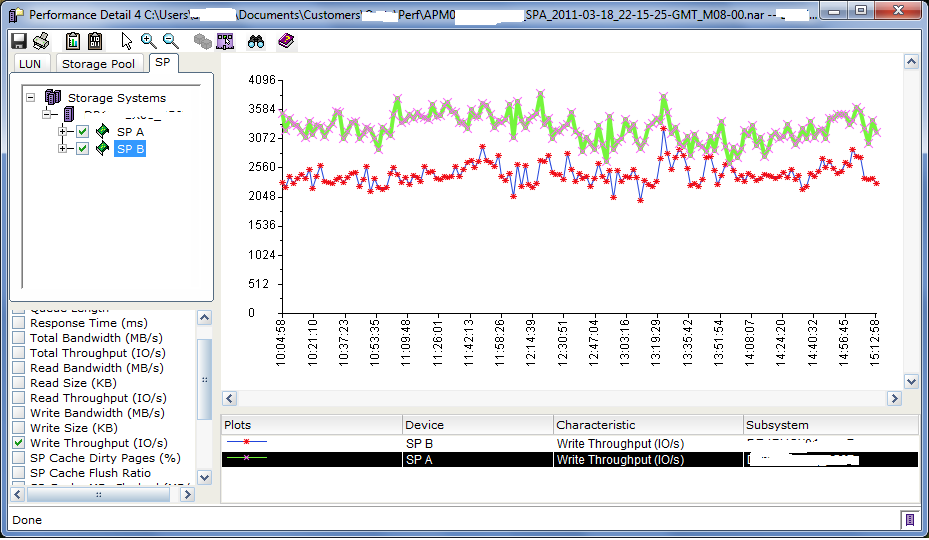
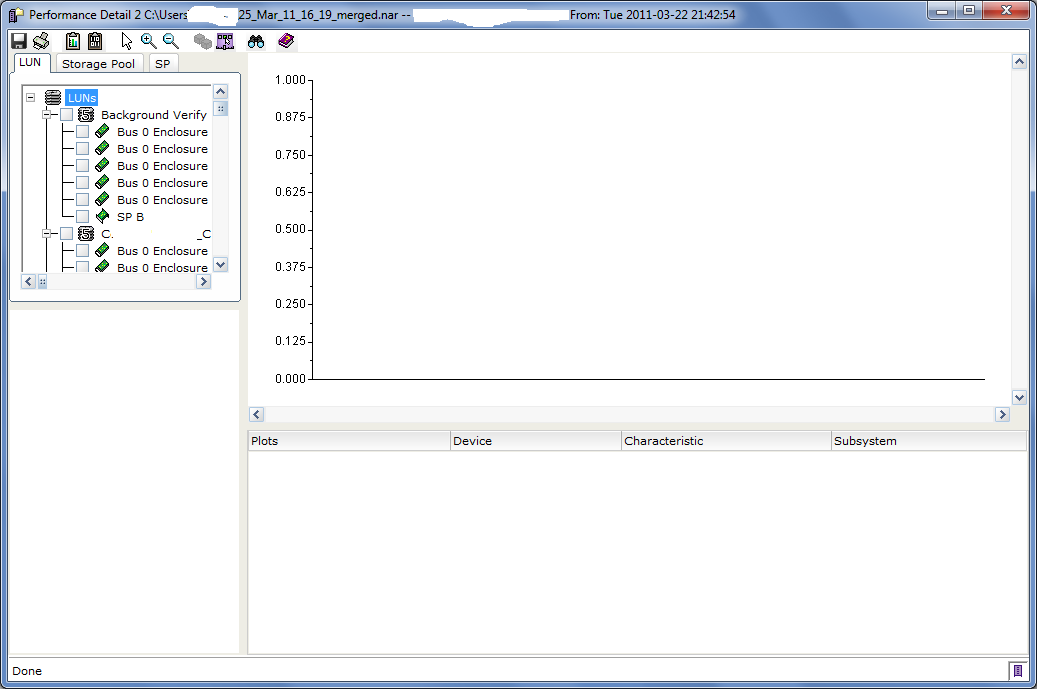
In the last post, we looked at the storage processor statistics to check for cache health, excessive queuing, and response time issues and found that SPA has some performance degradation which seems to be related to write IO. Now we need to drill down on the individual LUNs to see where that IO is being directed. This is done in the LUN tab of Analyzer. First, right click on the storage array itself in the left pane and choose deselect all -> items. Then click the LUN tab and right click on the top level of the tree “LUNs”, choose select all -> LUNs. Click on one of the LUNs to highlight it, then in choose Write Throughput (IO/s) from the bottom pane. It may take a second for Analyzer to render the graph but you’ll end up with something like this…
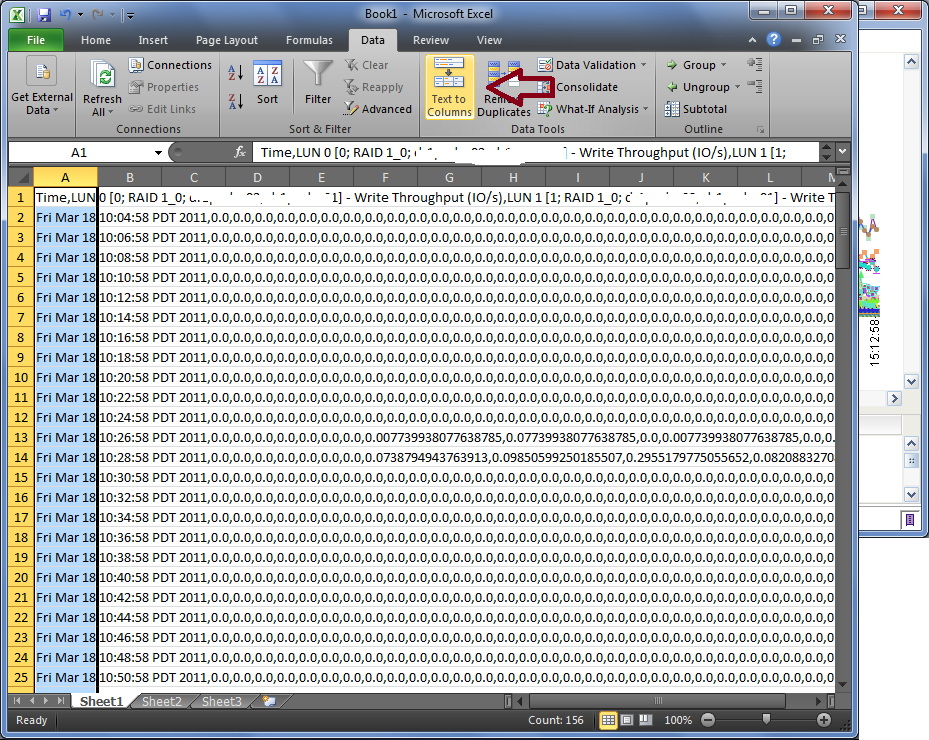
You’ll quickly realize that this view doesn’t really help you figure out what’s going on. With many LUNs, there is simply too much data to display it this way. So click the clipboard button that has the I’s and O’s in it (next to the red arrow) to copy the graph data (in CSV format) into your desktop clipboard. Now launch Microsoft Excel, select cell A1 and type Ctrl-V to paste the data. It will look like the following image at first, with all LUNs statistics pasted into Column A.
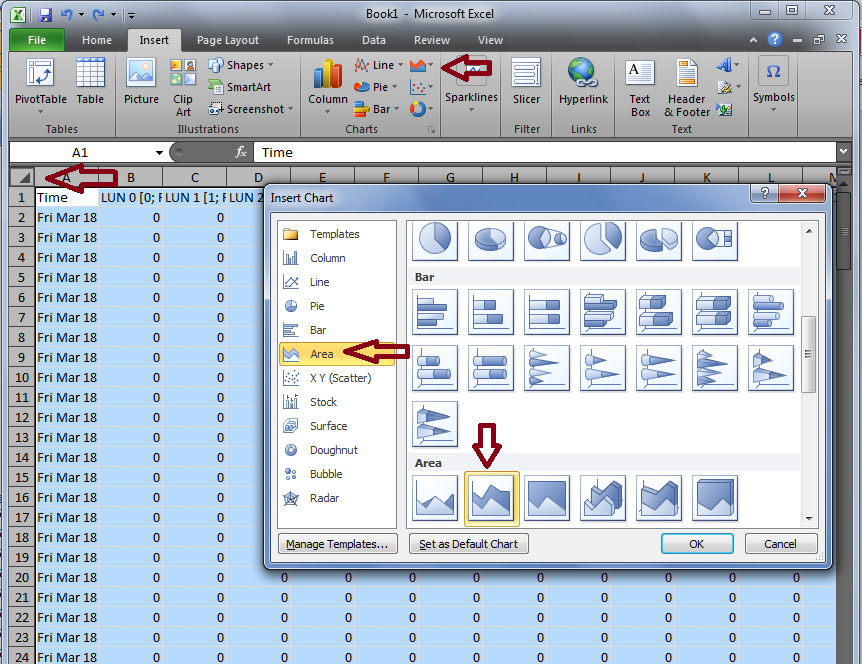
Now we need to break out the various metrics into their own columns to make meaningful data, so go to the Data menu and click Text to Columns (see red arrow above). Select Delimited, click Next.. Select ONLY comma as the delimiter, then next, next, finish. Excel will separate the data into many columns (one column per LUN). Next we’ll create a graph that can actually tell us something. First, click the triangle button at the upper left corner of the sheet to select all of the data in the sheet at once. Then click the area chart icon, select Area, then the Stacked Area (see Red Arrows below) icon. Click OK.
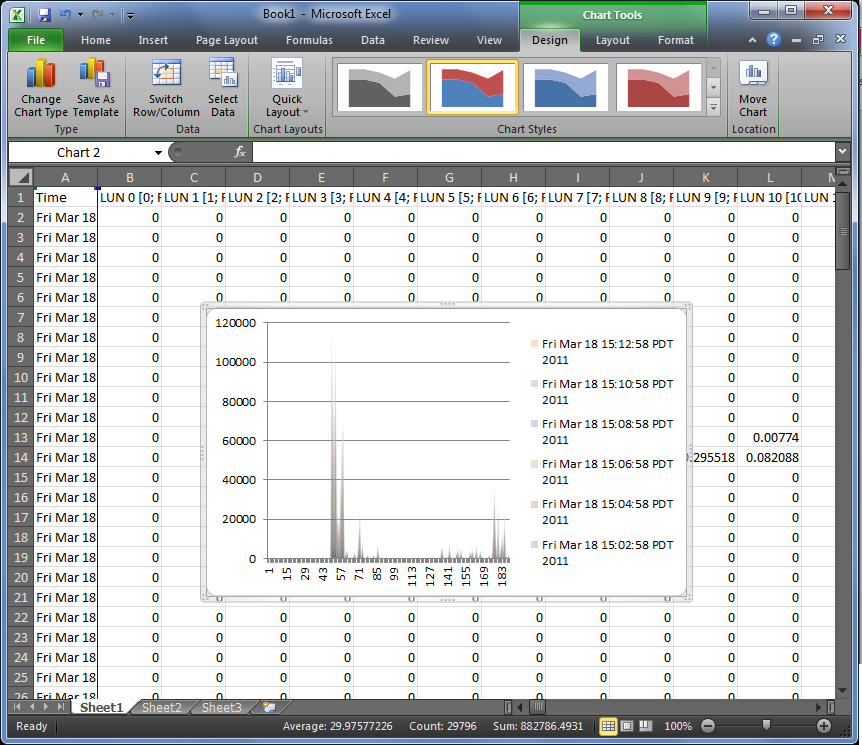
You’ll get a nice little graph like this one below that is completely useless because the default chart has the X and Y axis reversed from what we need for Analyzer data.
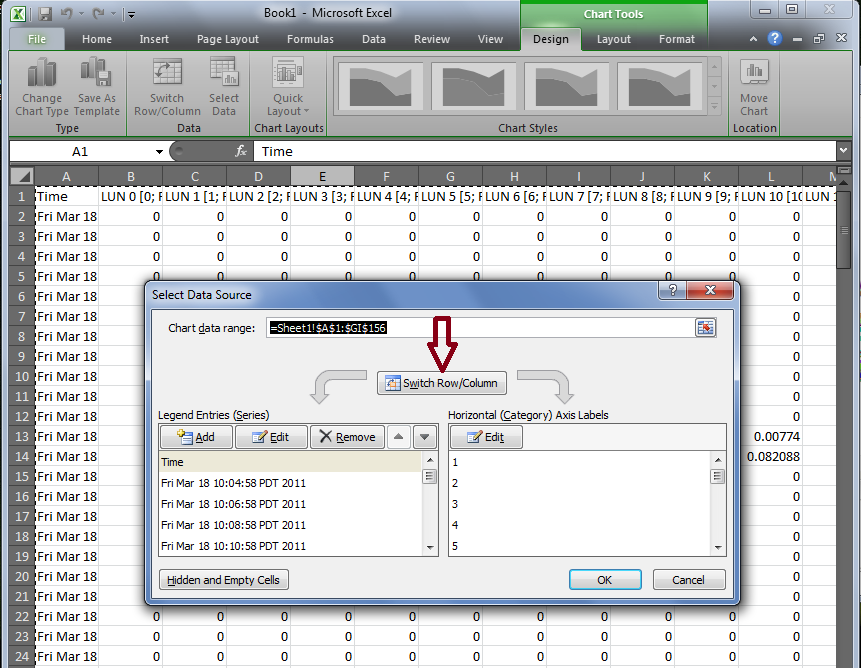
To Fix this, right click on the graph, choose “Select Data”, click the Switch row/column button, and click OK.
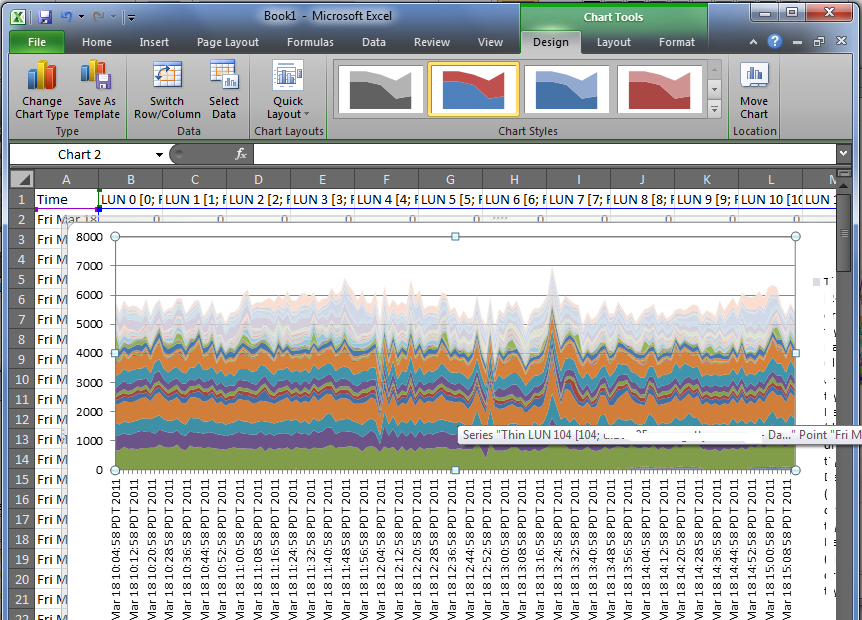
Now you have a useful graph like the one below. What we are seeing here is each band of color representing the Write IOPS for a particular LUN. You’ll note that about 6 LUNs have very thick bands, and the rest of the over 100 LUNs have very small bands. In this case, 6 LUNs are driving more than 50% of the total write IOPS on the array. Since the column header in the Excel sheet has the LUN data, you can mouse over the color band to see which LUN it represents.
Now that you know where to look, you can go back to Analyzer, deselect all LUNs and drill down to the individual LUNs you need to look at. You may also want to look at the hosts that are using the busy LUNs to see what they are doing. In Analyzer, check the Write IO Size for the LUNs you are interested in and see if the size is in line with your expectations for the application involved. Very large IO sizes coupled with high IOPS (ie: high bandwidth) may cause write cache contention. In the case of this particular array, these 6 LUNs are VMFS datastores, and based on the Thin LUN space utilization and write IO loads, I would recommend that the customer convert them from Thin LUNs to Thick LUNs in the same Virtual Pool. Thick LUNs have better write performance and lower processor overhead compared with Thin LUNs and the amount of free space in these Thin LUNs is fairly small. This conversion can be done online with no host impact using LUN Migration.
You can use this copy/paste technique with Excel to graph all sorts of complex datasets from Analyzer that are pretty much not viewable with the default Analyzer graph. This process lets you select specific data or groups of metrics from an complete Analyzer archive and graph just the data you want, in the way you want to see it. There is also a way to do this as a bulk export/import, which can be scheduled too, and I’ll discuss that in the next post.
<< Back to Part 3 — Part 4 — Go to Part 5 >>

