Monthly Archives: March 2011

Performance Analysis for Clariion and VNX – Part 2

Posted on by 11 comments

<< Back to Part 1 — Part 2 — Go to Part 3 >>

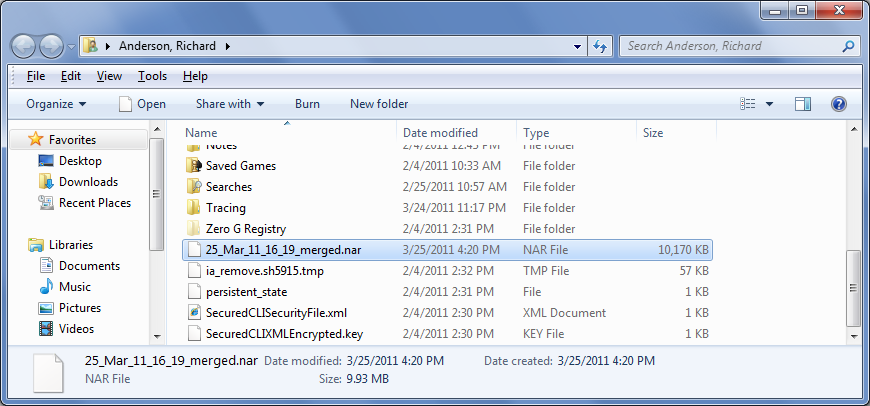
Okay, so you’ve got the Analyzer enabler on your array and enabled logging, and you’ve installed Unisphere Server, Unisphere Client, and Microsoft Excel on your workstation.  Next step is to download a NAR file from the array.  In Navisphere, right click on the array, go to the Analyzer menu and retrieve an archive.  You can get the archive from either SP of the array, both have the same data.  You will eventually see multiple NAR files, each covering some period of time.  Retrieve the one for the period of time you want to look at.  You can also merge multiple files together to get larger time periods into a single analyzer session.  In Unisphere, the process is essentially the same, select the array, go to Monitoring -> Analyzer.

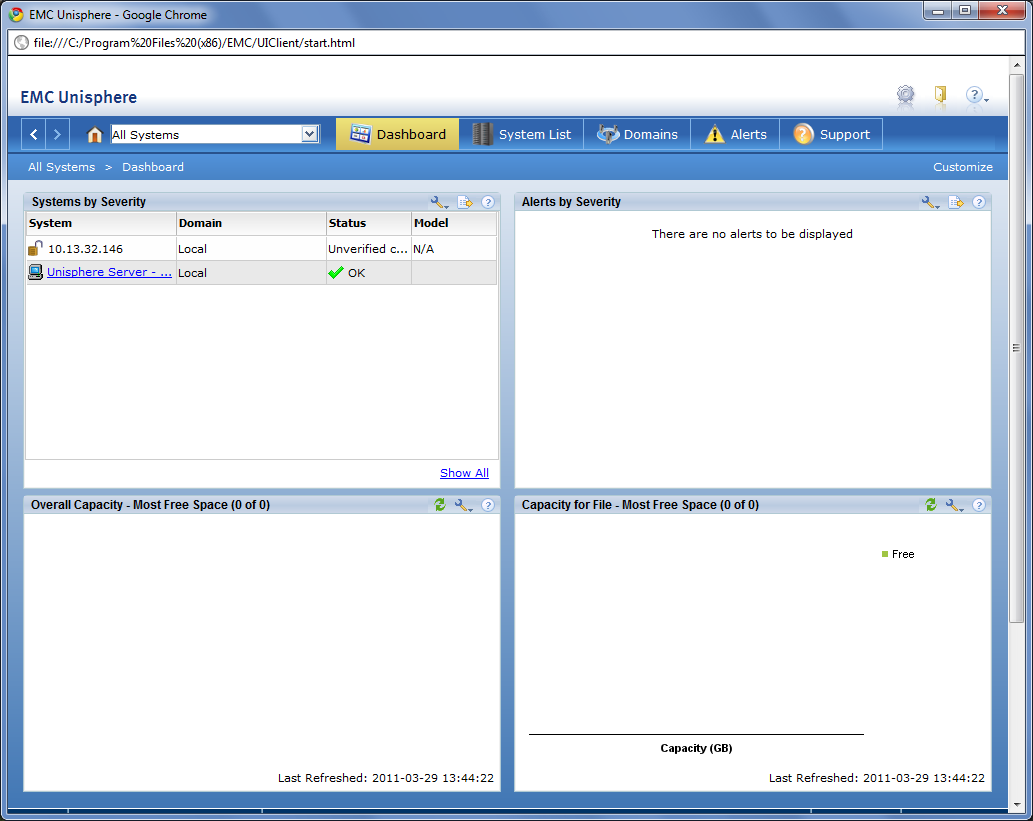
You’ve got your workstation set up and you have a NAR file downloaded to your workstation.  Let’s get to it.  Launch Unisphere Client from the Start Menu and connect to “localhost” when prompted.  Login to Unisphere.  You’ll see something like this…

In the drop down menu change to the “Unisphere Server – 127.0.0.1” which will change the main screen to Event Notification most likely.  Click on Monitoring, then Analyzer.

Let’s set some defaults before we open a NAR file.

  1. In the left pane, click Customize Charts
    1. In the General Tab, check the Advanced box so we can see more detailed metrics in Analyzer
    2. In the Archive Tab, under Analyzer, select Performance Detail and make sure Initially Check All Tree Objects is unchecked.
  1. Click OK to save.

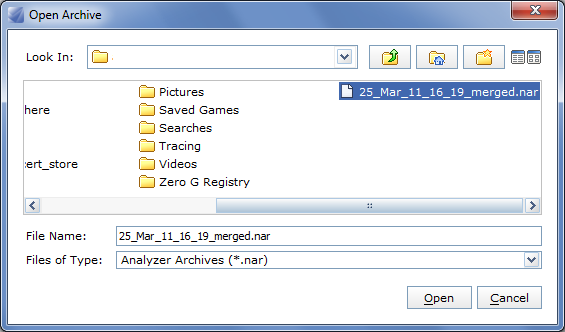
In the right pane, click on Open Archive , browse to the NAR file you want to view and open.

Because the NAR file can contain many hours (sometimes multiple days) or performance data, you will be prompted to set a time range.  The default times will show all data available in the archive.  If you want to narrow down to a smaller time range, change the Graph Start and End times, otherwise just click OK.

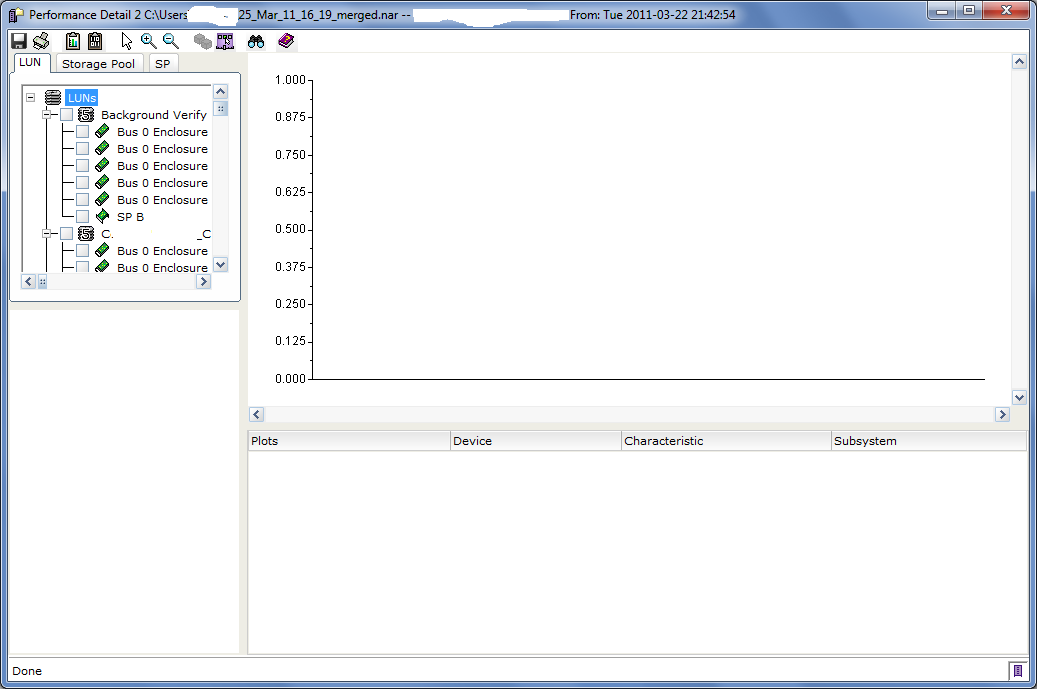
The Performance Detail window will launch and the LUN tab will be selected.  No items should be selected and as such no data will be graphed.

My personal methodology is to take a top-down approach when it comes to performance analysis and troubleshooting.

  • Check the SP’s, Cache, and SP Ports for obvious issues.  If a user is complaining of poor performance the Cache is usually the first place I look.
  • Drill down to RAID Groups, Pools, and LUNs to find the culprits
  • Drill down to the physical disk level if necessary
  • Export data to Excel for better graphs that make it easier to see whats happening

<< Back to Part 1 — Part 2 — Go to Part 3 >>

Performance Analysis for Clariion and VNX – Part 1

Posted on by
Part 1 — Go to Part 2 >>
  • Do you have an application owner complaining about performance?
  • Do you want to get a general idea of how your array is performing?
  • Do you want to turn this.. into this..?

I’ve been doing a lot of performance analysis with EMC Clariion CX3, CX4, and VNX storage recently and have a sort of an informal methodology I follow.  I’ve had a couple customers ask me to show them how to get useful data and graphs from their arrays and more recently after posting about FASTCache and FASTVP results I’ve had even more queries on the topic.  So I’ve decided to put together a sort of how-to guide.  It will take several posts to go through the whole process, so this first post will focus on making sure you have the right tools. The Tools: First, you MUST have the Navisphere/Unisphere Analyzer enabler on the storage array.  If you don’t have it, all you can really do is send an encrypted archive to EMC for help when you have a performance problem.  Analyzer is an indispensable performance analysis tool for CX/VNX systems and is really quite powerful.  Unfortunately, many customers don’t see the value during the purchase process but end up needing it someday in the future.  Make sure Analyzer is included in EVERY array purchase.

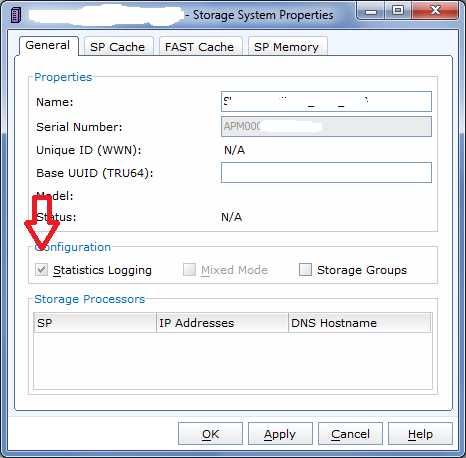
If you haven’t already, you also need to enable Statistics on the array AND in more recent versions of FLARE you need to enable Archive Logging.  Statistics logging is enabled in the array properties dialog, shown here…

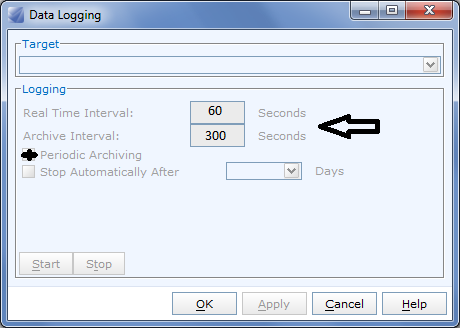
Archive Logging is enabled in the Monitoring -> Analyzer -> Data Logging dialog, shown here…

In practice, 5 minutes is a good interval for archives.  Also make sure that periodic archiving is enabled which will generate a new NAR file every so often (it depends on the interval)

Next, you need an Analyzer workstation.  You can run Analyzer directly off an array through Navisphere Manager or Unisphere but I prefer installing the software directly on my PC.  It lets me work on the analysis from home or anywhere else, and since I look at data from many different customer’s arrays’ it’s easier.  You can download the latest version of Unisphere Server and Unisphere Client directly from PowerLink (Home > Support > Software Downloads and Licensing > Downloads T-Z > Unisphere Server Software).  Once you install both, you can launch the client and log in to your local Unisphere server.   You can then open Analyzer archive files (NAR files) from any array for analysis. Third, you need a graphing tool.  I currently use Microsoft Excel 2010 on the same workstation as my Unisphere installation, which happens to be my corporate laptop.  While Analyzer does graph the data you select, there is only one type of graph available and sometimes when many objects are being graphed together it’s almost impossible to actually compare them to each other.

Another reason to use Excel is that while Analyzer has a wealth of different statistics available for all sorts of array objects, there are some exceptions right now.  For example, if you are using newer features such as FASTCache or FASTVP on your array and want to see statistics for those technologies, there is not much in Analyzer to see.  I’ll go through some methods for teasing that data out as well.

Part 1 — Go to Part 2 >>

If You Are Using SSDs, You Should Be Encrypting

Posted on by

I saw the following article come across Twitter today.

http://www.zdnet.com/blog/storage/ssd-security-the-worst-of-all-worlds/1326

In it, Robin Harris describes the issues around data recovery and secure erasure specific to SSD disks.  In layman’s terms, since SSDs do all sorts of fancy things with writes to increase longevity and performance, disk erasure is nearly impossible using normal methods, and forensic or malicious data recovery is quite easy.  So if you have sensitive data being stored on SSDs, that data is at risk of being read by someone, some day, in the future.  It seems that pretty much the only way to mitigate this risk is to use encryption at some level outside the SSD disk itself.

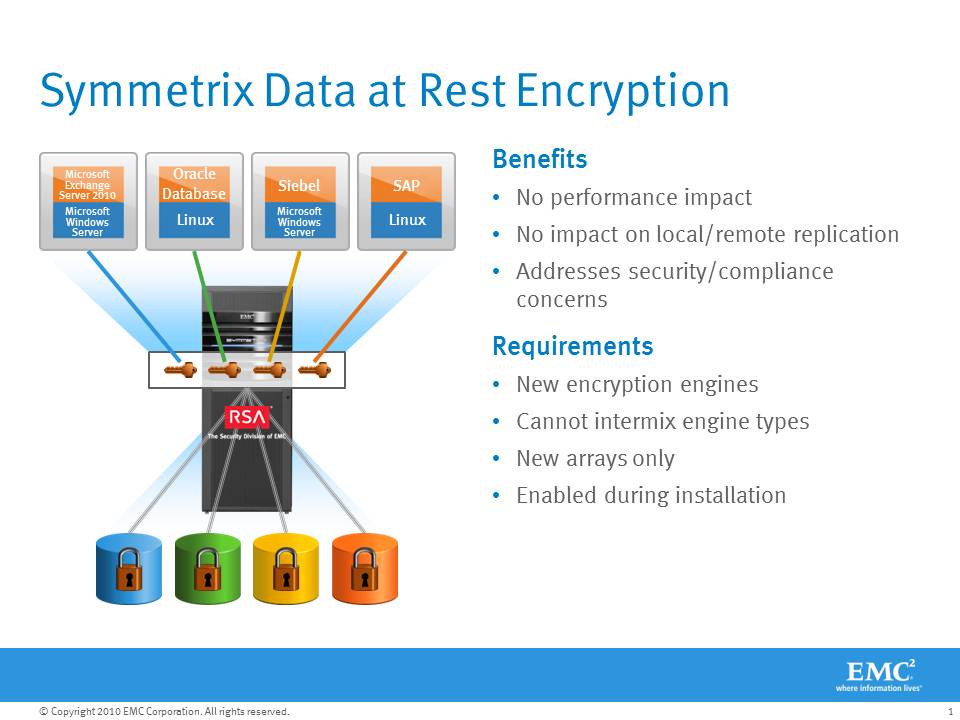
Did you know that EMC Symmetrix VMAX offers data-at-rest encryption that is completely transparent to hosts and applications, and has no performance impact?  With Symmetrix D@RE, each individual disk is encrypted with a unique key, managed by a built-in RSA key manager, so disks are unreadable if removed from the array.   Since the data is encrypted as the VMAX is writing to the physical disk, attempting to read data off an individual disk without the key is pointless, even for SSD disks.

The beauty of this feature is that it’s set-it-and-forget it.  No management needed, it’s enabled during installation and that’s it.  All disks are encrypted, all the time.

  • Ready to decomm an old array and return it, trade it, or sell it?  Destroy the keys and the data is gone.  No need for an expensive Data Erasure professional services engagement.
  • Failed disk replaced by your vendor?  No need for special arrangements with your vendor to keep those disks onsite, or certify erasure of a disk every time one is replaced.  The key stays with the array and the data on that disk is unreadable.

If you have to comply with PCI and/or other compliance rules that require secure erasure of disks, you should consider putting that data on a VMAX with data-at-rest encryption.

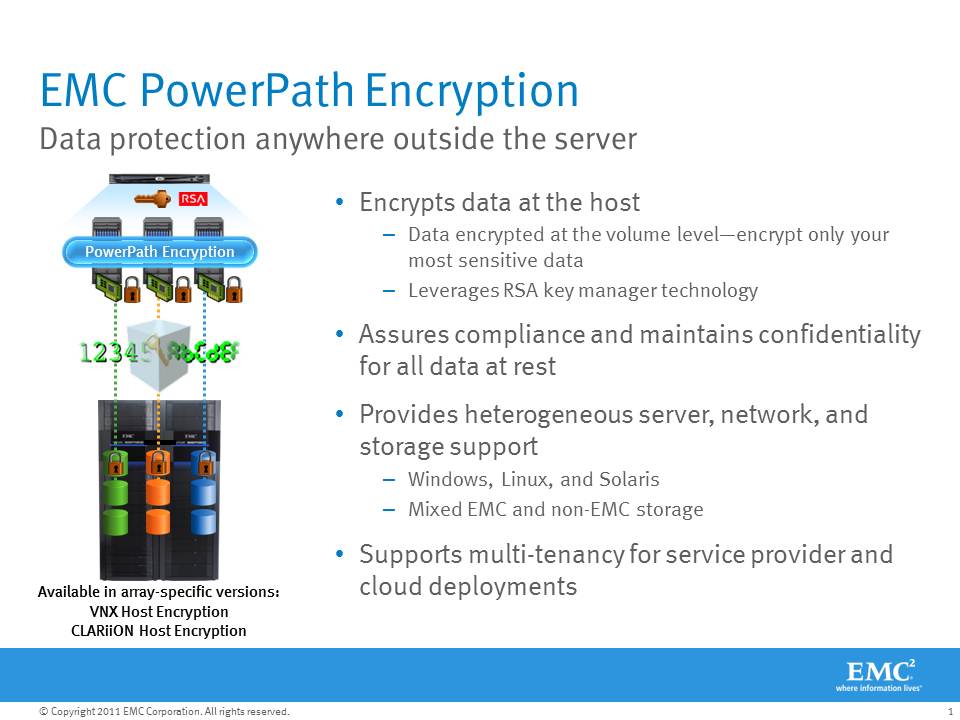
Now, What if you have an existing EMC storage system and the same need to encrypt data?  You can encrypt at the volume level with PowerPath Encryption.  PowerPath encrypts the data at the host with a unique key managed by an RSA Key Manager.  And it works with the non-EMC arrays that PowerPath supports as well.

Under normal circumstances, PowerPath Encryption does have some level of performance impact to the host however HBA vendors, such as Emulex, are now offering HBAs with encryption offload that works with PowerPath.  If you combine PowerPath Encryption with Emulex Encryption HBAs, you get in-flight AND at-rest encryption with near-zero performance impact.

  • Do you replicate your sensitive data to a 3rd party remote datacenter for business continuity?  PowerPath Encryption prevents unauthorized access to the data because no host can read it without the proper key.

Real World EMC FASTVP and FASTCache results!

Posted on by

I have a customer who just recently upgraded their EMC Celerra NS480 Unified Storage Array (based on Clariion CX4-480) to FLARE30 and enabled FASTCache across the array, as well as FASTVP automated tiering for a large amount of their block data.  Now that it’s been configured and the customer has performed a large amount of non-disruptive migrations of data from older RAID groups and VP pools into the newer FASTVP pool, including thick-to-thin conversions, I was able to get some performance data from their array and thought I’d share these results.

This is Real-World data

This is NOT some edge case where the customer’s workload is perfect for FASTCache and FASTVP and it’s also NOT a crazy configuration that would cost an arm and a leg.  This is a real production system running in a customer datacenter, with a few EFDs split between FASTCache and FASTVP and some SATA to augment capacity in the pool for their existing FC based LUNS.  These are REAL results that show how FASTVP has distributed the IO workload across all available disks and how a relatively small amount of FASTCache is absorbing a decent percentage of the total array workload.

This NS480 array has nearly 480 drives in total and has approximately 28TB of block data (I only counted consumed data on the thin LUNs) and about 100TB of NAS data.  Out of the 28TB of block LUNs, 20TB is in Virtual Pools, 14TB of which is in a single FASTVP Pool.  This array supports the customers’ ERP application, entire VMWare environment, SQL databases, and NAS shares simultaneously.

In this case FASTCache has been configured with just 183GB of usable capacity (4 x 100GB EFD disks) for the entire storage array (128TB of data) and is enabled for all LUNs and Pools.  The graphs here are from a 4 hour window of time after the very FIRST FASTVP re-allocation completed using only about 1 days’ worth of statistics.  Subsequent re-allocations in the FASTVP pool will tune the array even more.

FASTCache

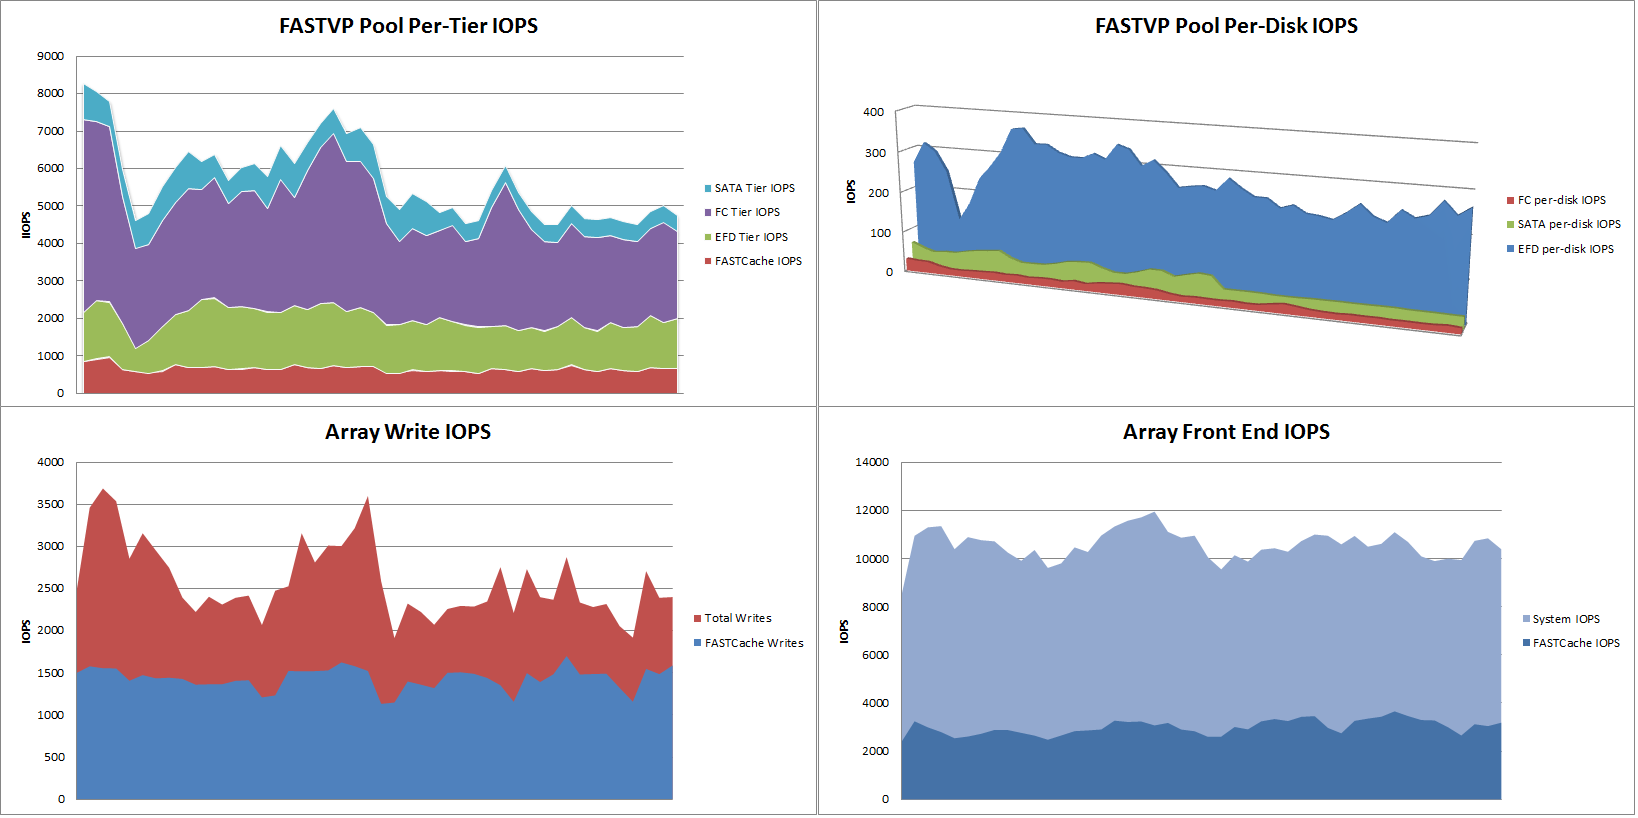
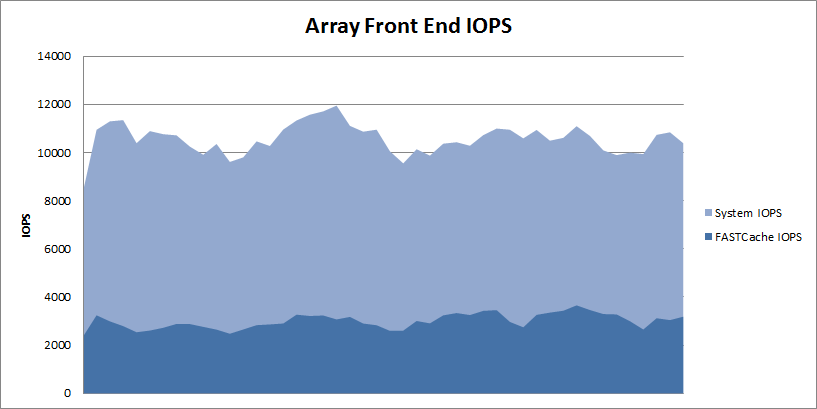
First, let’s take a look at the array as a whole, here you can see that the array is processing approximately ~10,000 IOPS through the entire interval.

FASTCache is handling about 25% of the entire workload with just 4 disks.  I didn’t graph it here but the total array IO Response time through this window is averaging 2.5 ms.  The pools and RAID Groups on this array are almost all RAID5 and the read/write ratio averages 60/40 which is a bit write heavy for RAID5 environments, generally speaking.

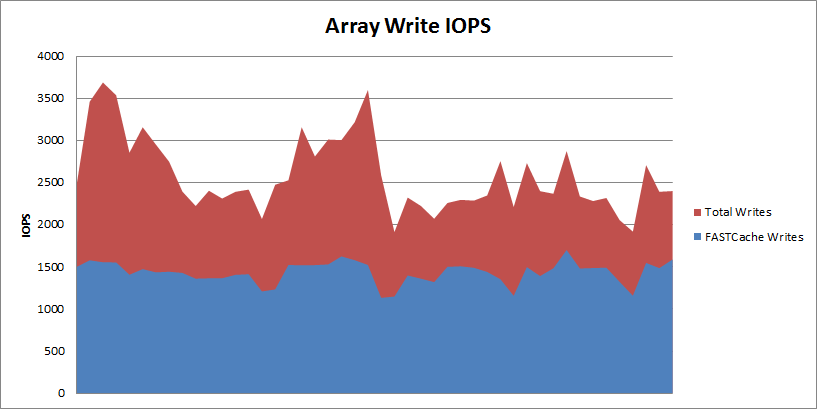
If you’ve done any reading about EMC FASTCache, you probably know that it is a read/write cache.  Let’s take a look at the write load of the array and see how much of that write load FASTCache is handling.  In the following graph you can see that out of the ~10,000 total IOPS, the array is averaging about 2500-3500 write IOPS with FASTCache handling about 1500 of that total.

That means FASTCache is reducing the back-end writes to disk by about 50% on this system.  On the NS480/CX4-480, FASTCache can be configured with up to 800GB usable capacity, so this array could see higher overall performance if needed by augmenting FASTCache further.  Installing and upgrading FASTCache is non-disruptive so you can start with a small amount and upgrade later if needed.

FASTVP and FASTCache Together

Next, we’ll drill down to the FASTVP pool which contains 190 total disks (5 x EFD, 170 x FC, and 15 x SATA).  There is no maximum number of drives in a Virtual Pool on FLARE30 so this pool could easily be much larger if desired.  I’ve graphed the IOPS-per-tier as well as the FASTCache IOPS associated with just this pool in a stacked graph to give an idea of total throughput for the pool as well as the individual tiers.

The pool is servicing between 5,000 and 8,000 IOPS on average which is about half of the total array workload.  In case you didn’t already know, FASTVP and FASTCache work together to make sure that data is not duplicated in EFDs.  If data has been promoted to the EFD tier in a pool, it will not be promoted to FASTCache, and vise-versa.  As a result of this intelligence, FASTCache acceleration is additive to an EFD-enabled FASTVP pool.   Here you can see that the EFD tier and FASTCache combined are servicing about 25-40% of the total workload, the FC tier another 40-50%, and the SATA tier services the remaining IOPS.  Keep in mind that FASTCache is accelerating IO for other Pools and RAID Group LUNs in addition to this one, so it’s not dedicated to just this pool (although that is configurable.)

FASTVP IO Distribution

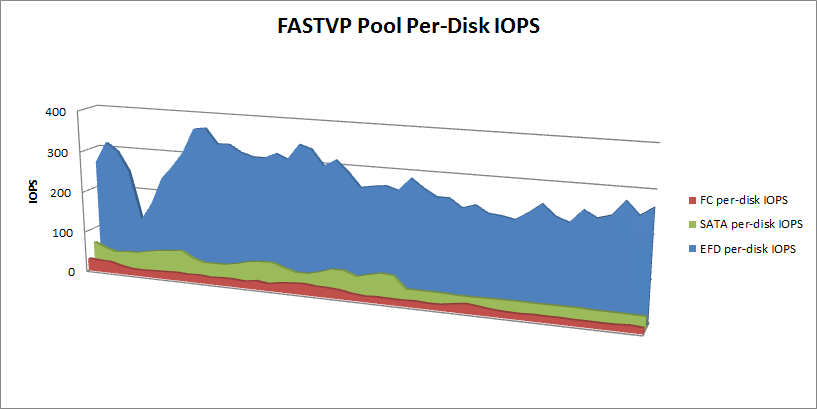
Lastly, to illustrate FASTVP’s effect on IO distribution at the physical disk layer, I’ve broken down IOPS-per-spindle-per-tier for this pool as well.  You can see that the FC disks are servicing relatively low IO and have plenty of head room available while the EFD disks, also not being stretched to their limits, are servicing vastly more IOPS per spindle, as expected.  The other thing you may have noticed here is that the EFDs are seeing the majority of the workload’s volatility, while the FC and SATA disks have a pretty flat workload over time.  This illustrates that FASTVP has placed the more bursty workloads on EFD where they can be serviced more effectively.

Hopefully you can see here how a very small amount of EFDs used with both FASTCache and FASTVP can relieve a significant portion of the workload from the rest of the disks.  FASTCache on this system adds up to only 0.14% of the total data set size and the EFD tier in the FASTVP pool only accounts for 2.6% of the total dataset in that pool.

What do you think of these results?  Have you added FASTCache and/or FASTVP to your array?  If so, what were your results?

Say Hello to EMC VNX7500

Posted on by

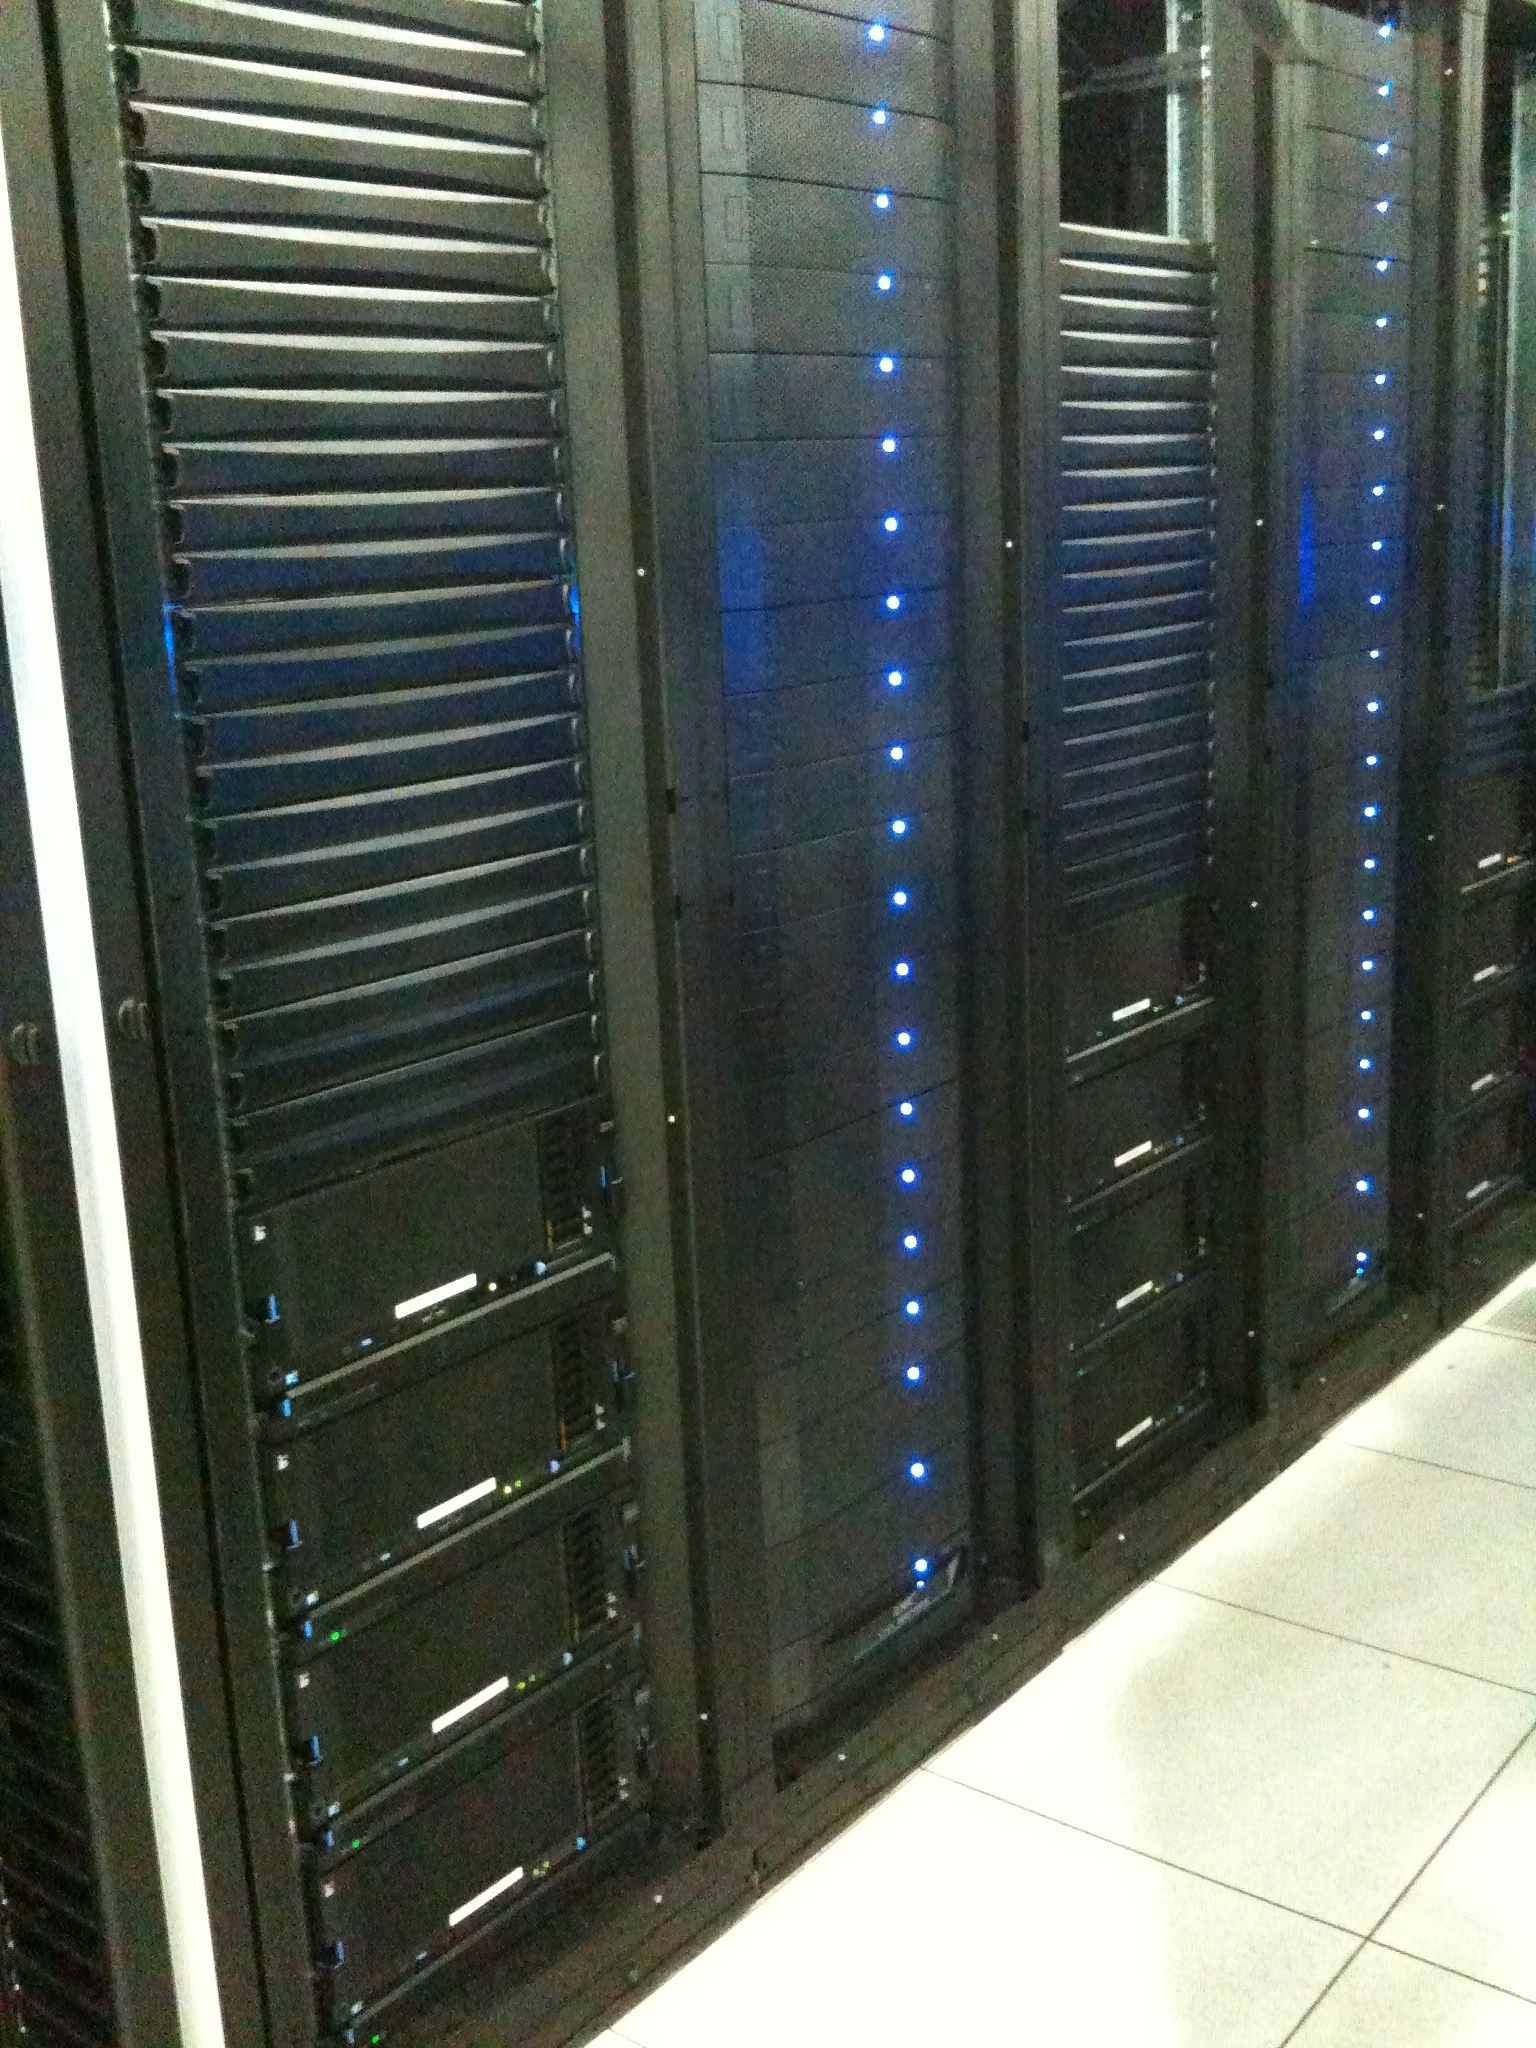
I got these pictures from one of my customers who completed install of two new EMC VNX7500 arrays.  It may be hard to tell but each of these systems host 21 x EFD drives and over 500 x SAS drives in a single rack.  Building on EMC’s promise of efficiency, each of these VNX arrays are delivering over 60,000 heavy-write host IOPS while providing 130TB of usable capacity in a single rack, consuming less power than the 4 servers in the neighboring rack.  Combined, these two arrays provide 260TB usable of extremely high performance storage to host many hundreds of production virtual servers.

VNX7500s installed and running