I have a customer who just recently upgraded their EMC Celerra NS480 Unified Storage Array (based on Clariion CX4-480) to FLARE30 and enabled FASTCache across the array, as well as FASTVP automated tiering for a large amount of their block data. Now that it’s been configured and the customer has performed a large amount of non-disruptive migrations of data from older RAID groups and VP pools into the newer FASTVP pool, including thick-to-thin conversions, I was able to get some performance data from their array and thought I’d share these results.
This is Real-World data
This is NOT some edge case where the customer’s workload is perfect for FASTCache and FASTVP and it’s also NOT a crazy configuration that would cost an arm and a leg. This is a real production system running in a customer datacenter, with a few EFDs split between FASTCache and FASTVP and some SATA to augment capacity in the pool for their existing FC based LUNS. These are REAL results that show how FASTVP has distributed the IO workload across all available disks and how a relatively small amount of FASTCache is absorbing a decent percentage of the total array workload.
This NS480 array has nearly 480 drives in total and has approximately 28TB of block data (I only counted consumed data on the thin LUNs) and about 100TB of NAS data. Out of the 28TB of block LUNs, 20TB is in Virtual Pools, 14TB of which is in a single FASTVP Pool. This array supports the customers’ ERP application, entire VMWare environment, SQL databases, and NAS shares simultaneously.
In this case FASTCache has been configured with just 183GB of usable capacity (4 x 100GB EFD disks) for the entire storage array (128TB of data) and is enabled for all LUNs and Pools. The graphs here are from a 4 hour window of time after the very FIRST FASTVP re-allocation completed using only about 1 days’ worth of statistics. Subsequent re-allocations in the FASTVP pool will tune the array even more.
FASTCache
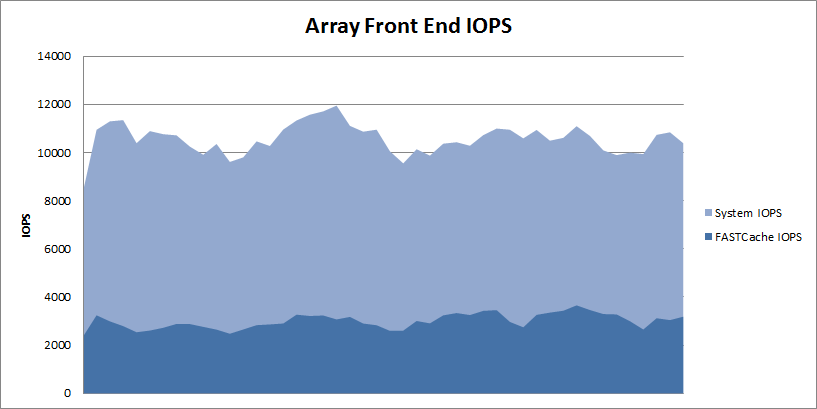
First, let’s take a look at the array as a whole, here you can see that the array is processing approximately ~10,000 IOPS through the entire interval.

FASTCache is handling about 25% of the entire workload with just 4 disks. I didn’t graph it here but the total array IO Response time through this window is averaging 2.5 ms. The pools and RAID Groups on this array are almost all RAID5 and the read/write ratio averages 60/40 which is a bit write heavy for RAID5 environments, generally speaking.
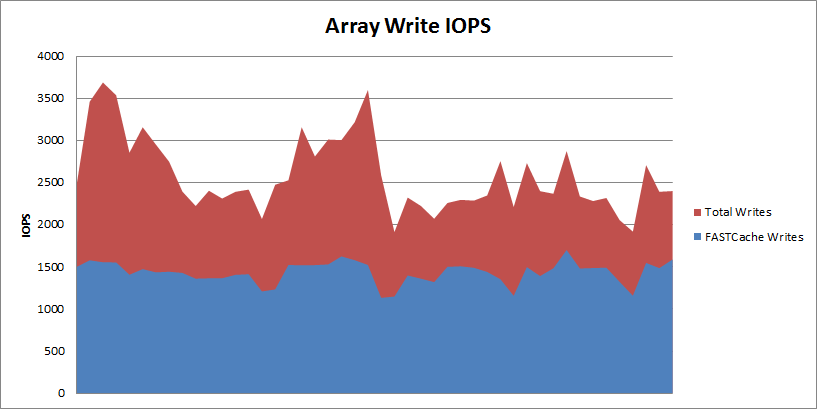
If you’ve done any reading about EMC FASTCache, you probably know that it is a read/write cache. Let’s take a look at the write load of the array and see how much of that write load FASTCache is handling. In the following graph you can see that out of the ~10,000 total IOPS, the array is averaging about 2500-3500 write IOPS with FASTCache handling about 1500 of that total.

That means FASTCache is reducing the back-end writes to disk by about 50% on this system. On the NS480/CX4-480, FASTCache can be configured with up to 800GB usable capacity, so this array could see higher overall performance if needed by augmenting FASTCache further. Installing and upgrading FASTCache is non-disruptive so you can start with a small amount and upgrade later if needed.
FASTVP and FASTCache Together
Next, we’ll drill down to the FASTVP pool which contains 190 total disks (5 x EFD, 170 x FC, and 15 x SATA). There is no maximum number of drives in a Virtual Pool on FLARE30 so this pool could easily be much larger if desired. I’ve graphed the IOPS-per-tier as well as the FASTCache IOPS associated with just this pool in a stacked graph to give an idea of total throughput for the pool as well as the individual tiers.
 The pool is servicing between 5,000 and 8,000 IOPS on average which is about half of the total array workload. In case you didn’t already know, FASTVP and FASTCache work together to make sure that data is not duplicated in EFDs. If data has been promoted to the EFD tier in a pool, it will not be promoted to FASTCache, and vise-versa. As a result of this intelligence, FASTCache acceleration is additive to an EFD-enabled FASTVP pool. Here you can see that the EFD tier and FASTCache combined are servicing about 25-40% of the total workload, the FC tier another 40-50%, and the SATA tier services the remaining IOPS. Keep in mind that FASTCache is accelerating IO for other Pools and RAID Group LUNs in addition to this one, so it’s not dedicated to just this pool (although that is configurable.)
FASTVP IO Distribution
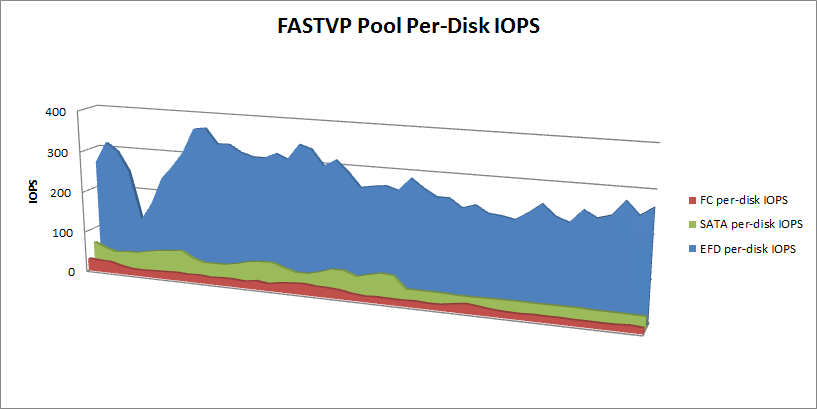
Lastly, to illustrate FASTVP’s effect on IO distribution at the physical disk layer, I’ve broken down IOPS-per-spindle-per-tier for this pool as well. You can see that the FC disks are servicing relatively low IO and have plenty of head room available while the EFD disks, also not being stretched to their limits, are servicing vastly more IOPS per spindle, as expected. The other thing you may have noticed here is that the EFDs are seeing the majority of the workload’s volatility, while the FC and SATA disks have a pretty flat workload over time.  This illustrates that FASTVP has placed the more bursty workloads on EFD where they can be serviced more effectively.
Hopefully you can see here how a very small amount of EFDs used with both FASTCache and FASTVP can relieve a significant portion of the workload from the rest of the disks. FASTCache on this system adds up to only 0.14% of the total data set size and the EFD tier in the FASTVP pool only accounts for 2.6% of the total dataset in that pool.
What do you think of these results? Have you added FASTCache and/or FASTVP to your array? If so, what were your results?


 Image from eWeek Article