Tag Archives: NAR

Find your busiest LUNs Fast with Unisphere Analyzer Search

Posted on by

One of the features that has been added to Analyzer (Navisphere and Unisphere) in recent versions is the ability to search for specific LUNs based on criteria.  This feature is actually pretty powerful because the criteria itself is pretty flexible.  For example, you can search for all LUNs attached to a specific host, or with a specific set of characters in the LUN name.  In addition you can search against performance metrics like Throughput, Response Time, or LUN Utilization.  This is where it gets interesting because you can look for poorly performing LUNs really quickly.  In the following example, I am going to build a search that looks for LUNs that have EX in the name (since all of my Exchange server LUNs have EX in the name) that ALSO have high LUN utilization for several polling intervals.

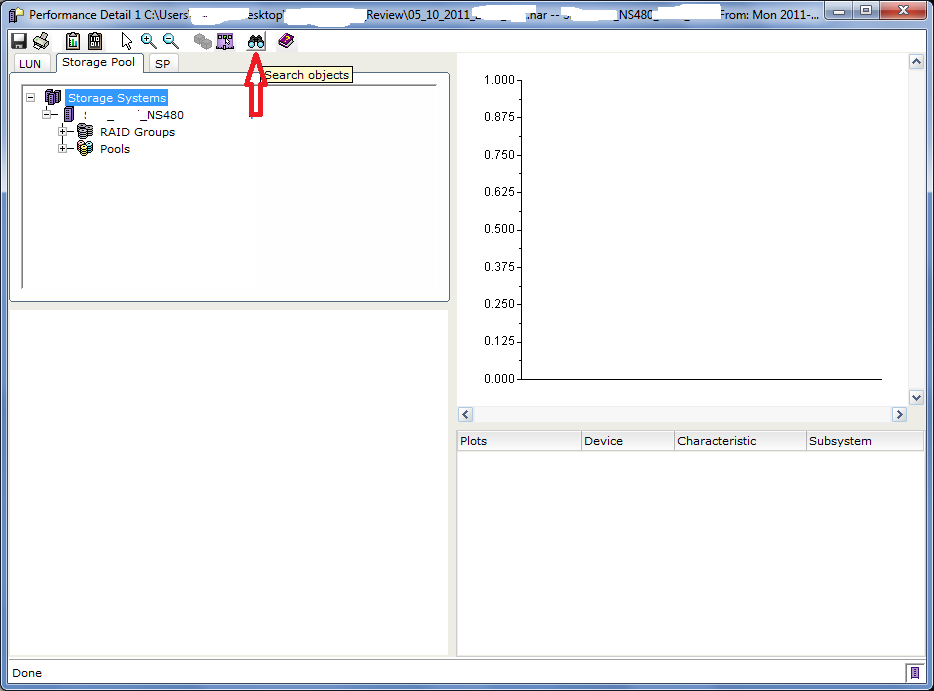
Once you’ve launched Analyzer and opened an Archive, click on the binocular icon in the tool bar to bring up the search dialog. 

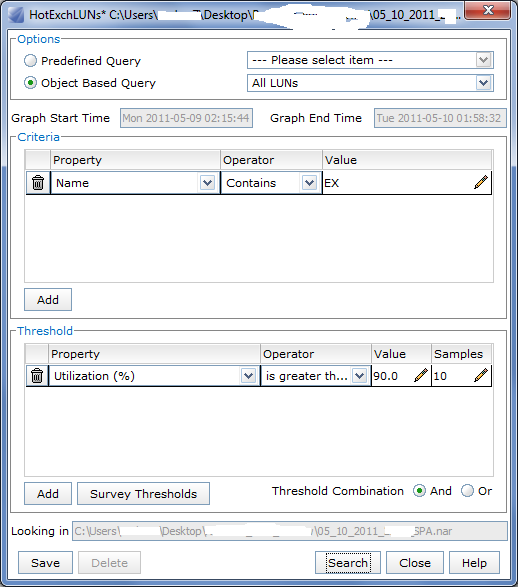
You can choose a predefined search (a search you previously created and saved) or a new Object Based Query.  In this example we are going to build a new query so select “Object Based Query” and choose All LUNs in the drop down box.  If you wanted, you could narrow down the search to just Pool Based LUNs, just MetaLUNs, or Component LUNs, etc.)

Next we’ll define the LUN criteria by selecting the Name property, choosing Contains, and entering the “EX” value.  This will filter the search to only those LUNs that have EX in the name.  Finally we’ll set a threshold.  In this example, I’m looking for LUNs that have a LUN Utilization value over greater than 90% for at least 10 polling samples.  I could add more LUN criteria and/or more thresholds to further narrow down the results with AND or OR combinations.

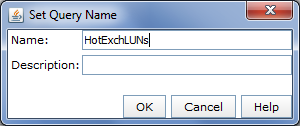
Optionally, you can save the query so that it will be listed in the “Predefined Query” list in the future.  Click Search and set or edit the name of the search.

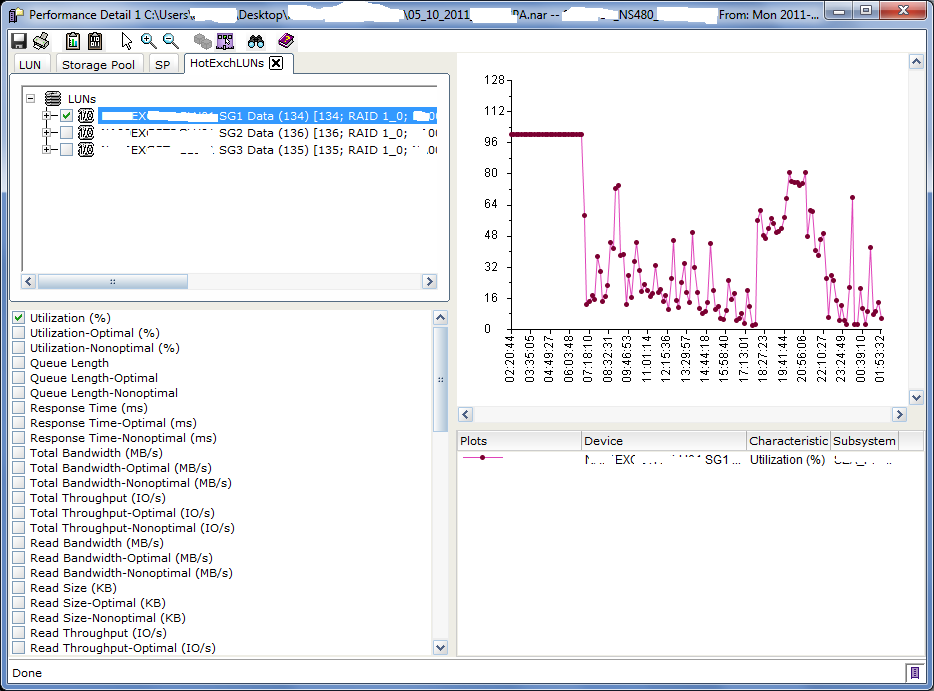
After clicking OK, Analyzer will create a new tab and populate the results of the search.  Once the search is complete you can graph metrics for the LUNs like normal.  Here I’ve selected Utilization to show why this LUN matched the search criteria — note the high utilization between 2am and 7am.

You can get much more granular with your searches if you are looking for something specific, or use metrics like Response Time to look for poorly performing LUNs attached to a specific server.  It’s pretty flexible.  I started using the search feature recently and thought others might be interested in it.  Try it out and let me know what you think.

Performance Analysis for Clariion and VNX – Part 5 (FASTCache)

Posted on by

<< Back to Part 4 — Part 5 — Go to Part 6 >>

Sorry for the delay on this next post..  Between EMC World and my 9 month old, it’s been a battle for time…

Okay, so you have an EMC Unified storage system (Clariion, Celerra, or VNX) with FASTCache and you’re wondering how FASTCache is helping you.  Today I’m going to walk you through how to tease FASTCache performance data out of Analyzer.

I’m assuming you already have Analyzer launched and opened a NAR archive.  One thing to understand about Analyzer stats as they relate to FASTCache, is that stats are gathered at the LUN level for traditional RAID Group LUNs, but for Pool based LUNs, the stats are gathered at the pool level.  As a result graphing data for FASTCache differs for the two scenarios.

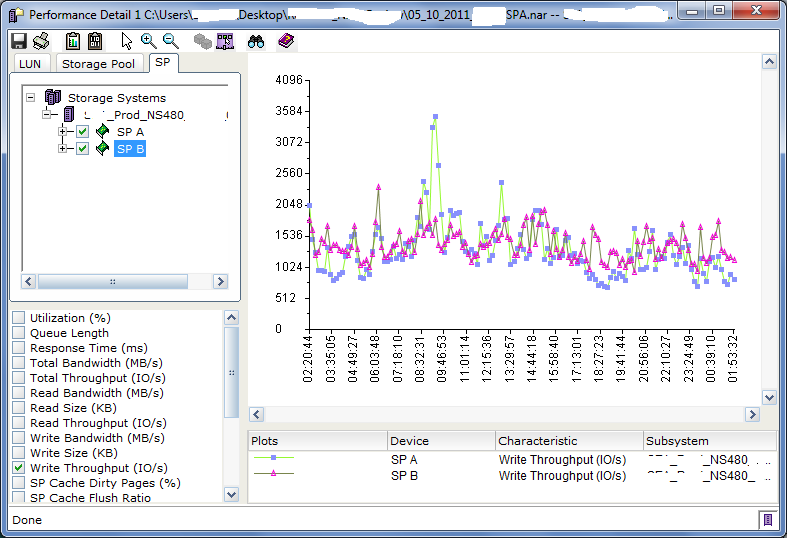
First we’ll take a look at the overall array performance.  Here we’ll see how much of the write workload is being handled by FASTCache.  In the SP Tab of Analyzer, select both SPs (be sure no LUNs or other objects are selected).  Select Write Throughput (IO/s), and then click the clipboard icon (with I’s and O’s).

Launch Microsoft Excel and paste into the sheet, and then perform the text-to-column change discussed in the previous post if necessary.

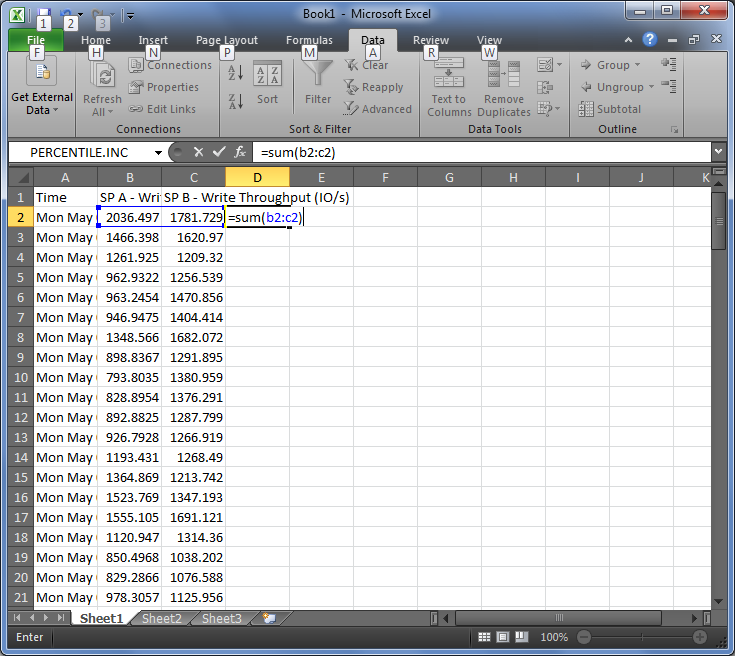
Next create a formula in the D column, adding the values for both SPs into a single total.  We’re not going to graph it quite yet though.

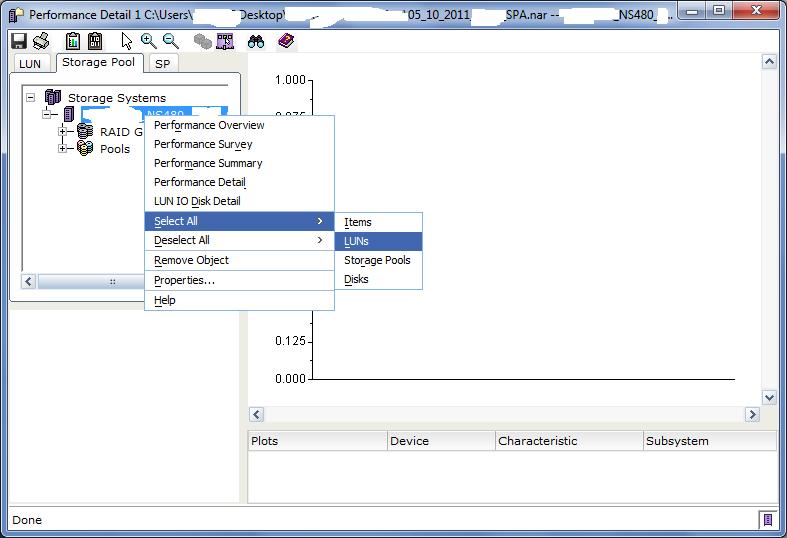
Back in Analyzer, deselect the two SPs, switch to the Storage Pool Tab, right-click on the array and choose Select All -> LUNs, then Select All -> Pools.

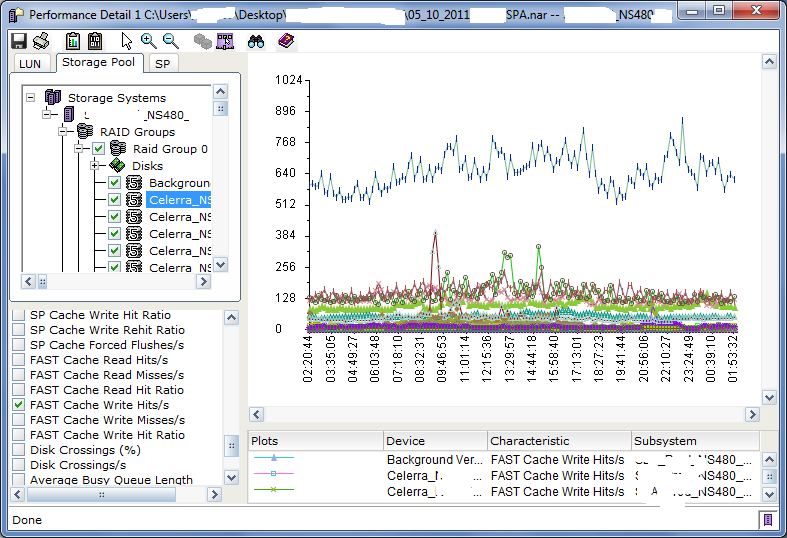
Click on a RAID Group LUN or Pool in the tree, it doesn’t matter which one, deselect Write Throughput (IO/s) and select FAST Cache Write Hits/s.  In a moment, you’ll end up with a graph like this.

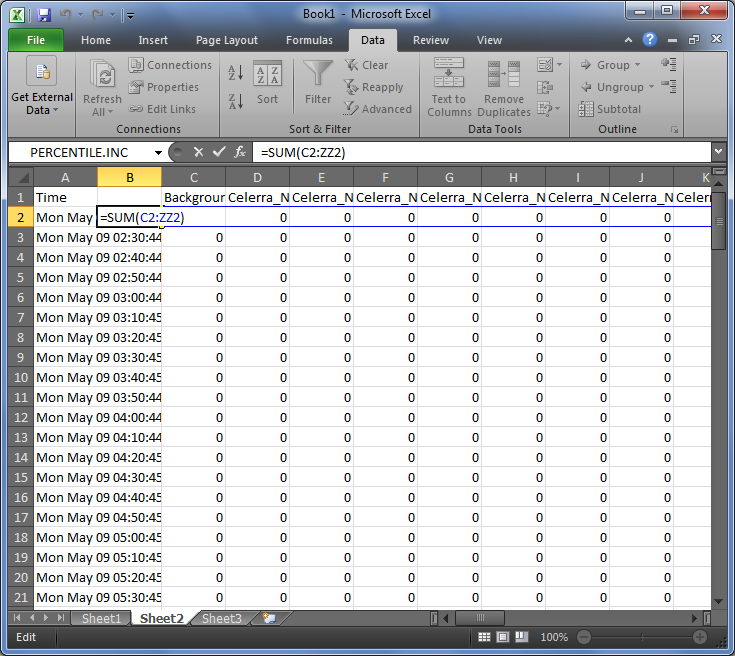
Click the clipboard icon again to copy this data and paste it into a new sheet of the same workbook in Excel.  Insert a blank column between column A and B, then create a formula to add the values from column B through ZZ (ie: =SUM(C2:ZZ2).

Then copy that formula and paste into every row of column B.  This column will be our Total FAST Cache Write Hits for the whole array.  Finally, click the header for Column B to select it, then copy (CTRL-C).  Back to the first sheet — Paste the “Values” (123 Icon) into Column E.

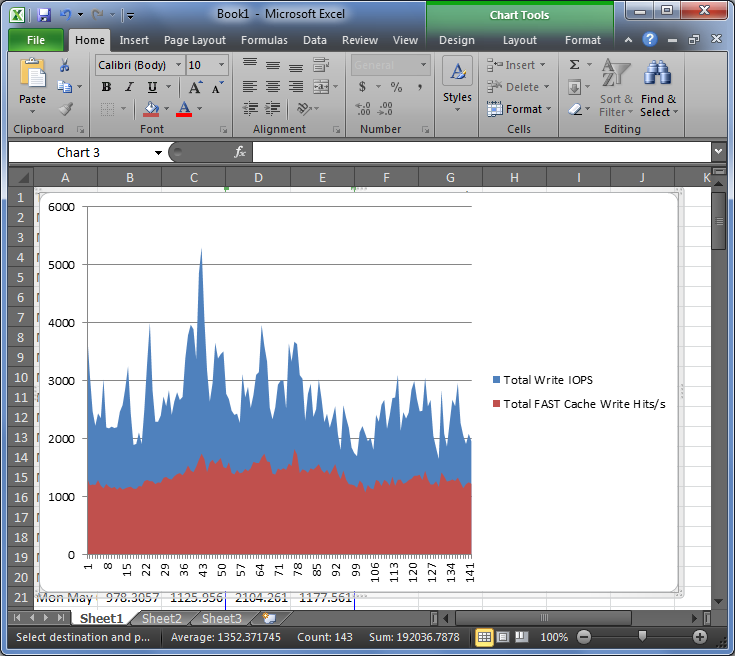
Now that we have the Total Write IOPS and Total FAST Cache Write Hits in adjacent columns of the same worksheet, we can graph them together.  Select both columns (D and E in my example), click Insert, and choose 2D Area Chart.  You’ll get a nice little graph that looks something like the following.

Since it’s a 2D Area Chart, and not a stacked graph, the FASTCache Write IOPS are layered over the Total Write IOPS such that visually it shows the portion of total IOPS handled by FASTCache.  Follow this same process again for Read Throughput and FASTCache Read Hits.  Furthur manipulation in Excel will allow you to look at total IOPS (read and write) or drill down to individual Pools or RAID Group LUNs.

Another thing to note when looking at FASTCache stats…  FAST Cache Misses are IOPS that were not handled by FASTCache, but they may still have been handled by SP Cache.  So in order to get a feel for how many read IOs are actually hitting the disks, you’d actually want to subtract SP Read Cache Hits and Total FASTCache Read Hits (calculated similar to the above example) from SP Read Throughput.  This is similar for Write Cache Misses as well.

I hope this helps you better understand your FASTCache workload.  I’ll be working on FASTVP next, which is quite a bit more involved.

<< Back to Part 4 — Part 5 — Go to Part 6 >>

Performance Analysis for Clariion and VNX – Part 4

Posted on by

<< Back to Part 3 — Part 4 — Go to Part 5 >>

Making Lemonade from Lemons.

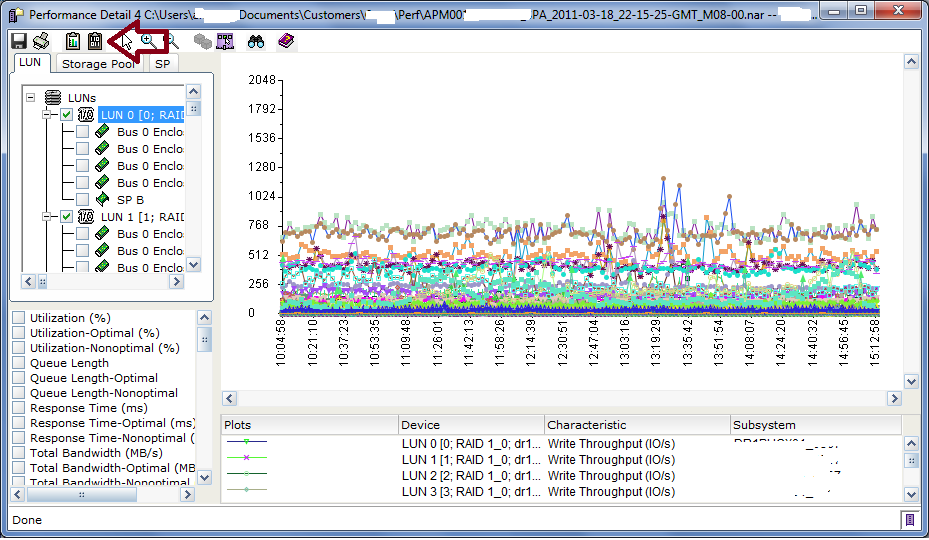
In the last post, we looked at the storage processor statistics to check for cache health, excessive queuing, and response time issues and found that SPA has some performance degradation which seems to be related to write IO.  Now we need to drill down on the individual LUNs to see where that IO is being directed.  This is done in the LUN tab of Analyzer.  First, right click on the storage array itself in the left pane and choose deselect all -> items.  Then click the LUN tab and right click on the top level of the tree “LUNs”, choose select all -> LUNs.  Click on one of the LUNs to highlight it, then in choose Write Throughput (IO/s) from the bottom pane.  It may take a second for Analyzer to render the graph but you’ll end up with something like this…

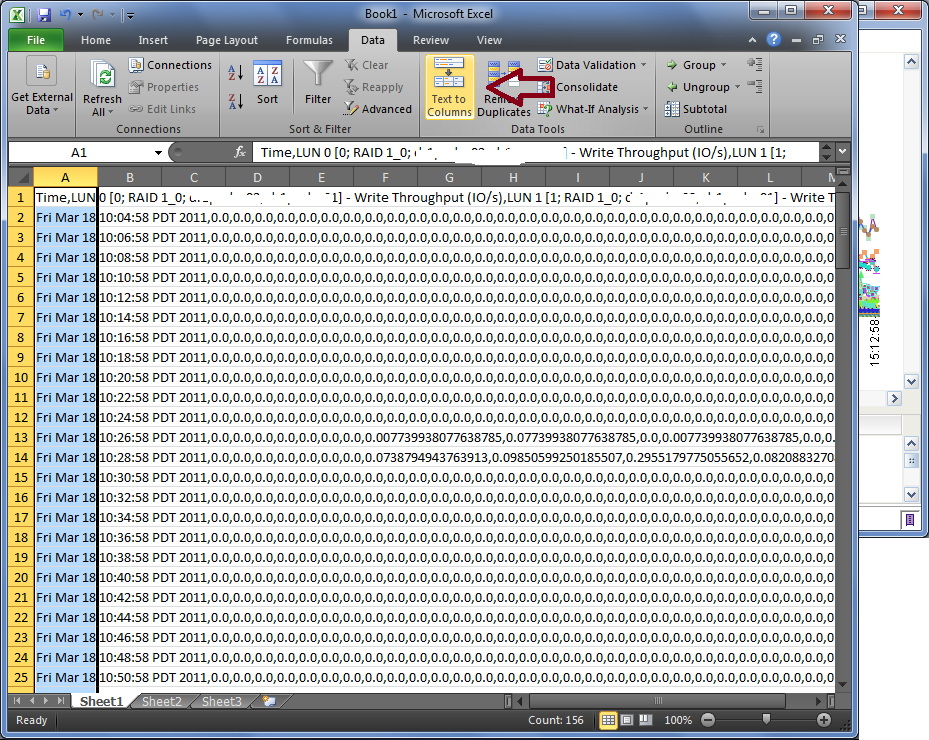
You’ll quickly realize that this view doesn’t really help you figure out what’s going on.  With many LUNs, there is simply too much data to display it this way.  So click the clipboard button that has the I’s and O’s in it (next to the red arrow) to copy the graph data (in CSV format) into your desktop clipboard.  Now launch Microsoft Excel, select cell A1 and type Ctrl-V to paste the data.  It will look like the following image at first, with all LUNs statistics pasted into Column A.

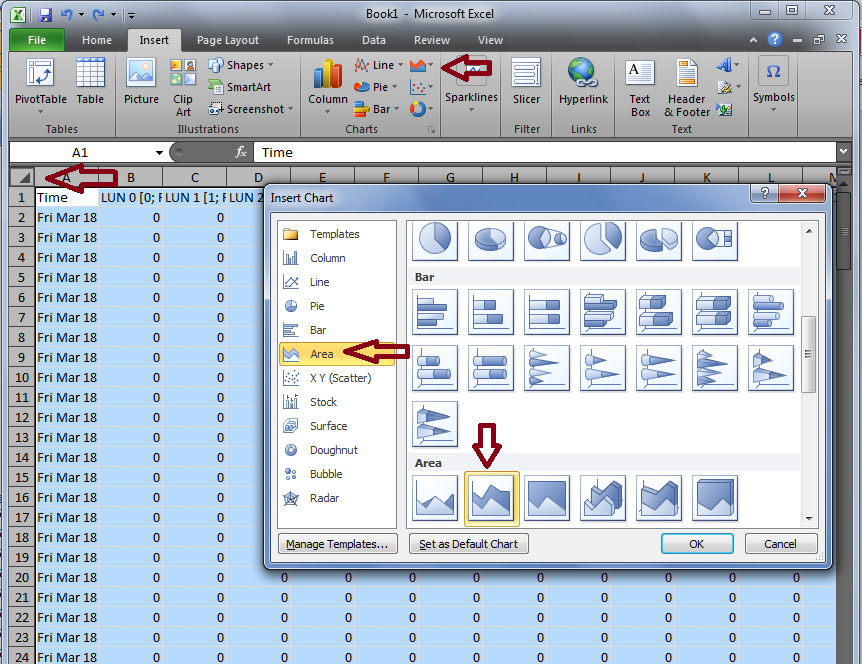
Now we need to break out the various metrics into their own columns to make meaningful data, so go to the Data menu and click Text to Columns (see red arrow above).  Select Delimited, click Next..  Select ONLY comma as the delimiter, then next, next, finish.  Excel will separate the data into many columns (one column per LUN).  Next we’ll create a graph that can actually tell us something.  First, click the triangle button at the upper left corner of the sheet to select all of the data in the sheet at once.  Then click the area chart icon, select Area, then the Stacked Area (see Red Arrows below) icon.  Click OK.

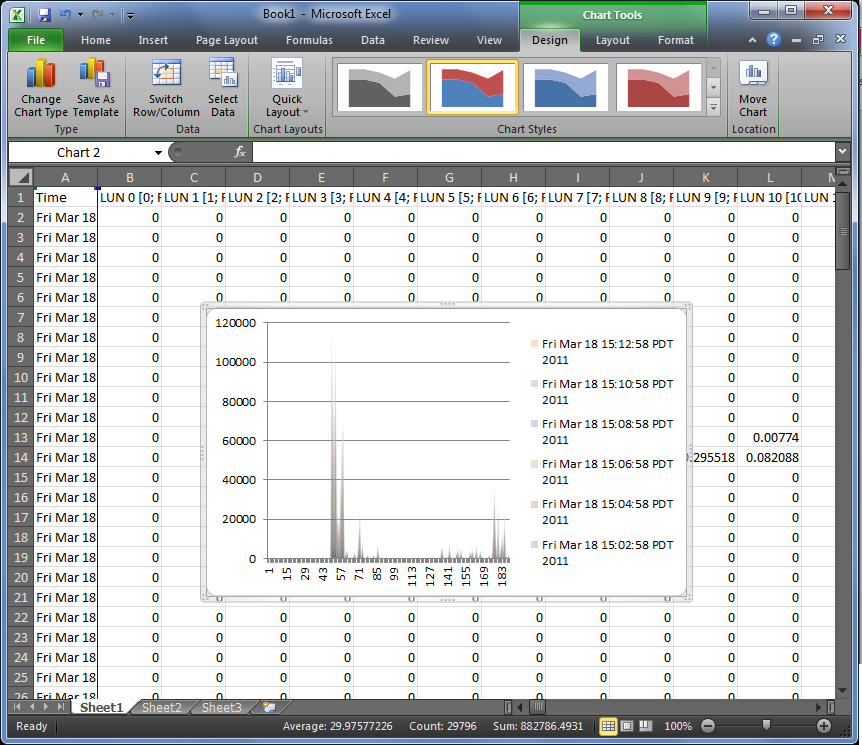
You’ll get a nice little graph like this one below that is completely useless because the default chart has the X and Y axis reversed from what we need for Analyzer data.

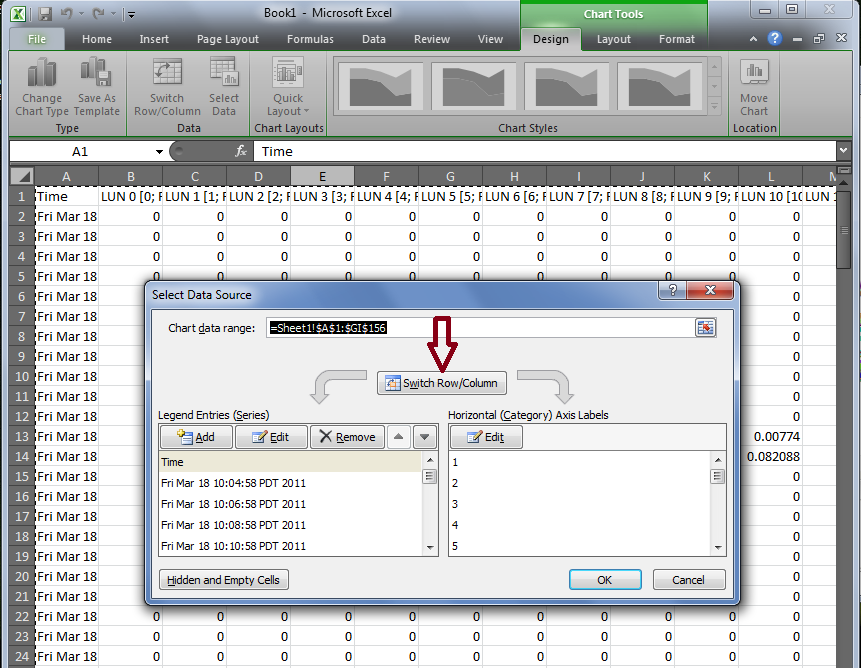
To Fix this, right click on the graph, choose “Select Data”, click the Switch row/column button, and click OK.

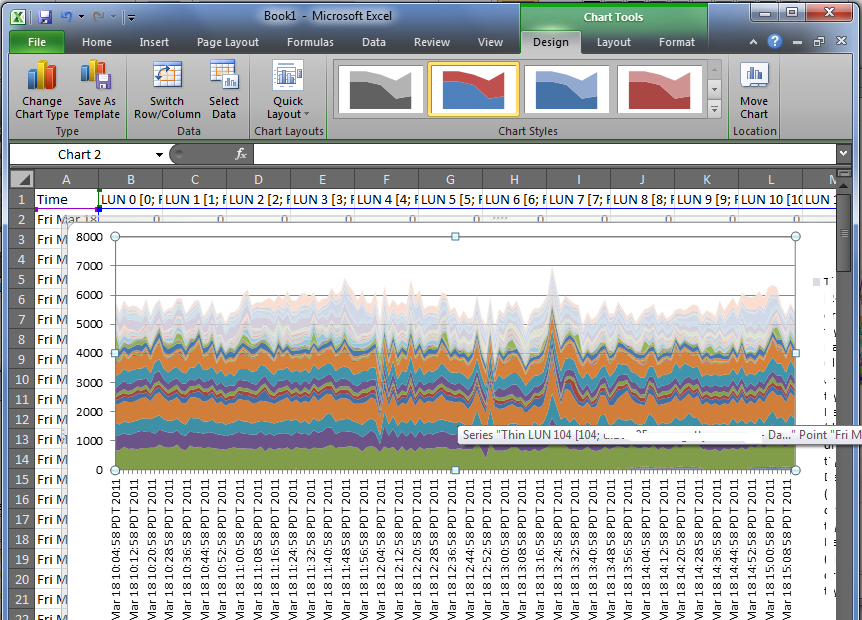
Now you have a useful graph like the one below.  What we are seeing here is each band of color representing the Write IOPS for a particular LUN.  You’ll note that about 6 LUNs have very thick bands, and the rest of the over 100 LUNs have very small bands.  In this case, 6 LUNs are driving more than 50% of the total write IOPS on the array. Since the column header in the Excel sheet has the LUN data, you can mouse over the color band to see which LUN it represents.

Now that you know where to look, you can go back to Analyzer, deselect all LUNs and drill down to the individual LUNs you need to look at.  You may also want to look at the hosts that are using the busy LUNs to see what they are doing.  In Analyzer, check the Write IO Size for the LUNs you are interested in and see if the size is in line with your expectations for the application involved. Very large IO sizes coupled with high IOPS (ie: high bandwidth) may cause write cache contention.  In the case of this particular array, these 6 LUNs are VMFS datastores, and based on the Thin LUN space utilization and write IO loads, I would recommend that the customer convert them from Thin LUNs to Thick LUNs in the same Virtual Pool.  Thick LUNs have better write performance and lower processor overhead compared with Thin LUNs and the amount of free space in these Thin LUNs is fairly small.  This conversion can be done online with no host impact using LUN Migration.

You can use this copy/paste technique with Excel to graph all sorts of complex datasets from Analyzer that are pretty much not viewable with the default Analyzer graph.  This process lets you select specific data or groups of metrics from an complete Analyzer archive and graph just the data you want, in the way you want to see it.  There is also a way to do this as a bulk export/import, which can be scheduled too, and I’ll discuss that in the next post.

<< Back to Part 3 — Part 4 — Go to Part 5 >>

Performance Analysis for Clariion and VNX – Part 3

Posted on by

<< Back to Part 2 — Part 3 — Go to Part 4 >>

Disclaimer: Performance Analysis is an art, not a science.  Every array is different, every application is different, and every environment has a different mix of both.  These posts are an attempt to get you started in looking at what the array is doing and pointing you in a direction to go about addressing a problem.  Keep in mind, a healthy array for one customer could be a poorly performing array for a different customer.  It all comes down to application requirements and workload.  Large block IO tends to have higher response times vs. small block IO for example.  Sequential IO also has a smaller benefit from (and sometimes can be hindered by) cache.  High IOPS and/or Bandwidth is not a problem, in fact it is proof that your array is doing work for you.  But understanding where the high IOPS are coming from and whether a particular portion of the IO is a problem is important.  You will not be able to read these series of posts and immediately dive in and resolve a performance problem on your array.  But after reading these, I hope you will be more comfortable looking at how the system is performing and when users complain about a performance problem, you will know where to start looking.  If you have a major performance issue and need help, open an case.

Starting from the top…

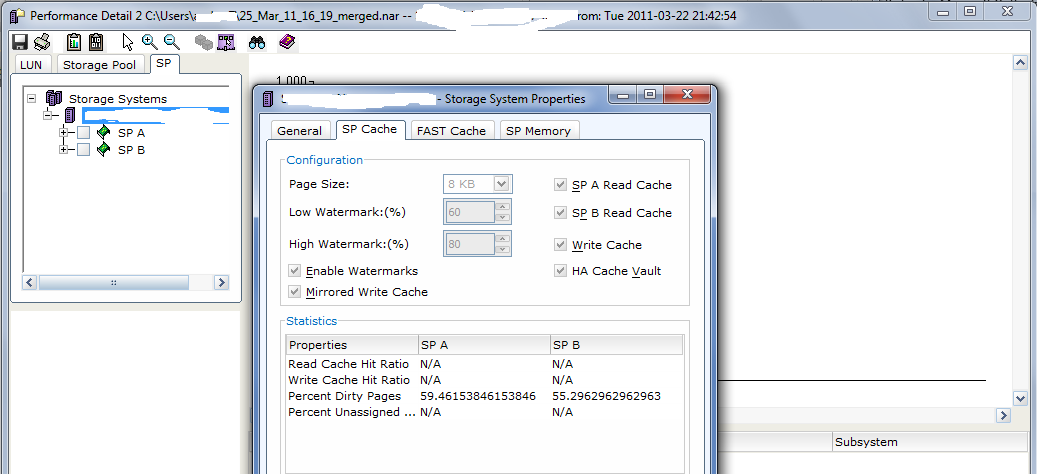
First let’s check the health of the front end processors and cache.  The data for this is in the SP Tab which shows both of the SPs.  The first thing I like to look at is the “SP Cache Dirty Pages (%)” but to make this data more meaningful we need to know what the write cache watermarks are set to.  You can find this by right-clicking on the array object in the upper-left pane and choosing properties.  The watermarks are shown in the SP Cache tab.

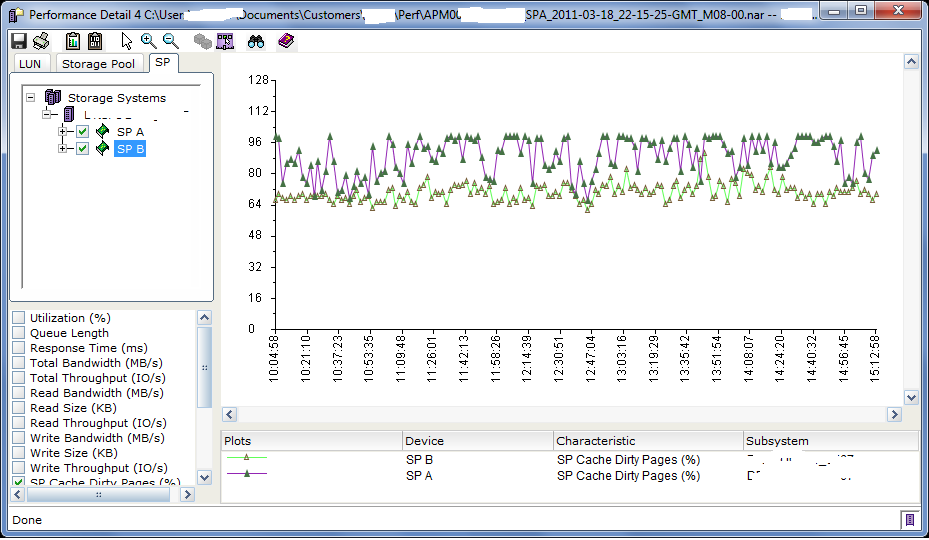
Once you note the watermarks, close the properties window and check the boxes for SPA and SPB.  In the lower pane, deselect utilization and chose SP Cache Dirty Pages (%).

Dirty pages are pages in write cache that have received new data from hosts, but have not been flushed to disk.  Generally speaking you want to have a high percentage of dirty pages because it increases the chance of a read coming from cache or additional writes to the same block of data being absorbed by the cache.  Any time an IO is served from cache, the performance is better than if the data had to be retrieved from disk.  This is why the default watermarks are usually around 60/80% or 70/90%.


What you don’t want is for dirty pages to reach 100%.  If the write cache is healthy, you will see the dirty pages value fluctuating between the high and low watermarks (as SPB is doing in the graph).  Periodic spikes or drops outside the watermarks are fine, but repeatedly hitting 100% indicates that the write cache is being stressed (SPA is having this issue on this system).  The storage system compensates for a full cache by briefly delaying host IO and going into a forced flushing state.  Forced Flushes are high priority operations to get data moved out of cache and onto the back end disks to free up write cache for more writes.  This WILL cause performance degradation.  Sustained Large Block Write IO is a common culprit here.

While we’re here, deselect Dirty Pages (%) and select Utilization (%) and look for two things here:

1.) Is either SP running at a load of higher than 70%?  This will increase application response time.  Check whether the SPs seem to fluctuate with the business day.  For non-disruptive upgrades, both SPs need to be under 50% utilization.

2.) Are the two SPs balanced?  If one is much busier than the other that may be something to investigate.

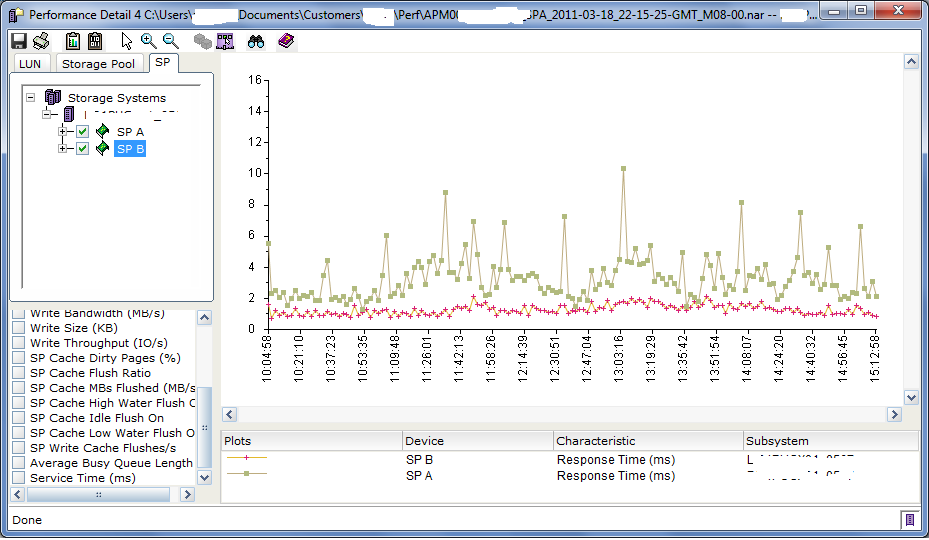
Now look at Response time (ms) and make sure that, again, both SPs are relatively even, and that Response time is within reasonable levels.  If you see that one SP has high utilization and response time but the other SP does not, there may be a LUN or set of LUNs owned by the busy SP that are consuming more array resources.  Looking at Total Throughput and Total Bandwidth can help confirm this, and then graphing Read vs. Write Throughput and Bandwidth to see what the IO operations actually are.  If both SPs have relatively similar throughput but one SP has much higher bandwidth, then there is likely some large block IO occurring that you may want to track down.

As an example, I’ve now seen two different customers where a Microsoft Sharepoint server running in a virtual machine (on a VMFS datastore) had a stuck process that caused SQL to drive nearly 200MB/sec of disk bandwidth to the backend array.  Not enough to cause huge issues, but enough to overdrive the disks in that LUN’s RAID Group, increasing queue length on the disks and SP, which in turn increased SP utilization and response time on the array.  This increased response time affected other applications unrelated to Sharepoint.

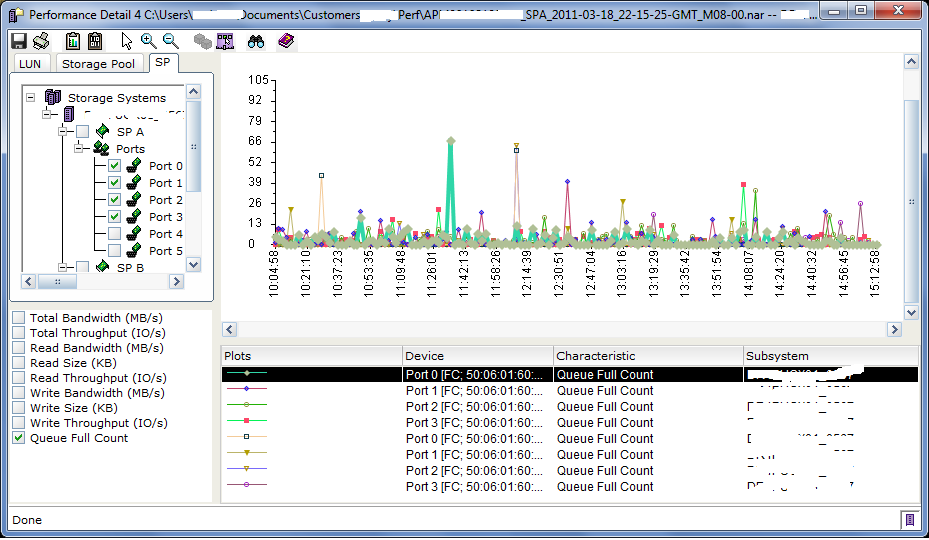
Next, let’s check the Port Queue Full Count.  This is the number of times that a front end port issued a QFULL response back to the hosts.   If you are seeing QFULL’s there are two possible causes.. One is that the Queue Depth on the HBA is too large for the LUNs being accessed.  Each LUN on the array has a maximum queue depth that is calculated using a formula based on the number of data disks in the RAID Group.  For example, a RAID5 4+1 LUN will have a queue depth of 88.  Assuming your HBA queue depth is 64 then you won’t have a problem.  However, if the LUN is used in a cluster file system (Oracle ASM, VMWare VMFS, etc) where multiple hosts are accessing the LUN simultaneously, you could run into problems here.  Reducing the HBA Queue Depth on the hosts will alleviate this issue.

The second cause is when there are many hosts accessing the same front end ports and the HBA Execution Throttle is too large on those hosts.  A Clariion/VNX front end port has a queue depth of 1600 which is the maximum number of simultaneous IO’s that port can process.  If there are 1600 IOs in queue and another IO is issued, the port responds with QFULL.   The host HBA responds by lowering its own Queue Depth (per LUN) to 1 and then gradually increasing the queue depth over time back to normal.  An example situation might be 10 hosts, all driving lots of IO, with HBA Execution Throttle set to 255.  It’s possible that those ten hosts can send a total of 2550 IOs simultaneously.  If they are all driving that IO to the same front end port, that will flood the port queue.  Reducing the HBA Execution throttle on the hosts will alleviate this issue.

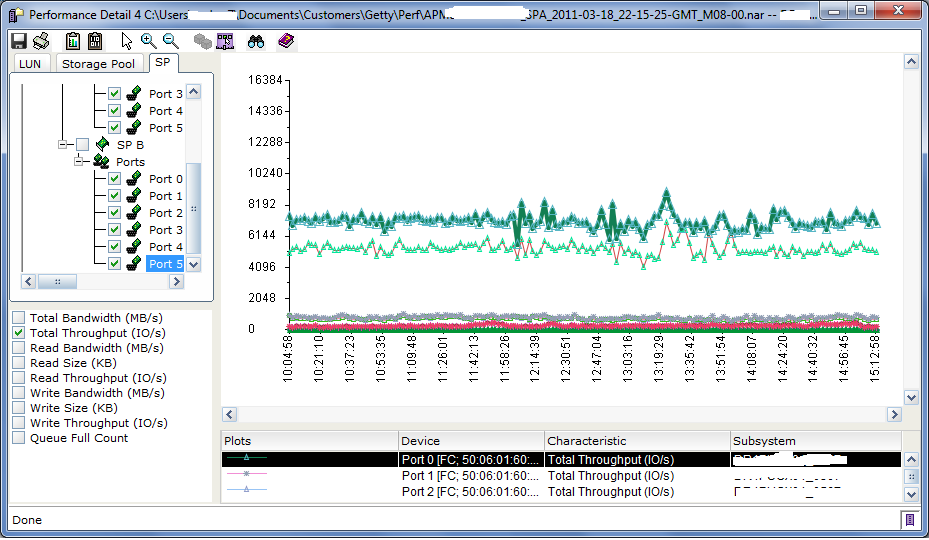
Looking at the Port Throughput, you can see here that 2 ports are driving the majority of the workload.  This isn’t necessarily a problem by itself, but PowerPath could help spread the load across the ports which could potentially improve performance.

In VMWare environments specifically, it is very common to see many hosts all accessing many LUNs over only 1 or 2 paths even though there may be 4 or 8 paths available.  This is due to the default path selection (lowest port) on boot.  This could increase the chances of a QFULL problem as mentioned above or possibly exceeding the available bandwidth of the ports.  You can manually change the paths on each LUN on each host in a VMWare cluster to balance the load, or use Round-Robin load balancing.  PowerPath/VE automatically load balances the IO across all active paths with zero management overhead.

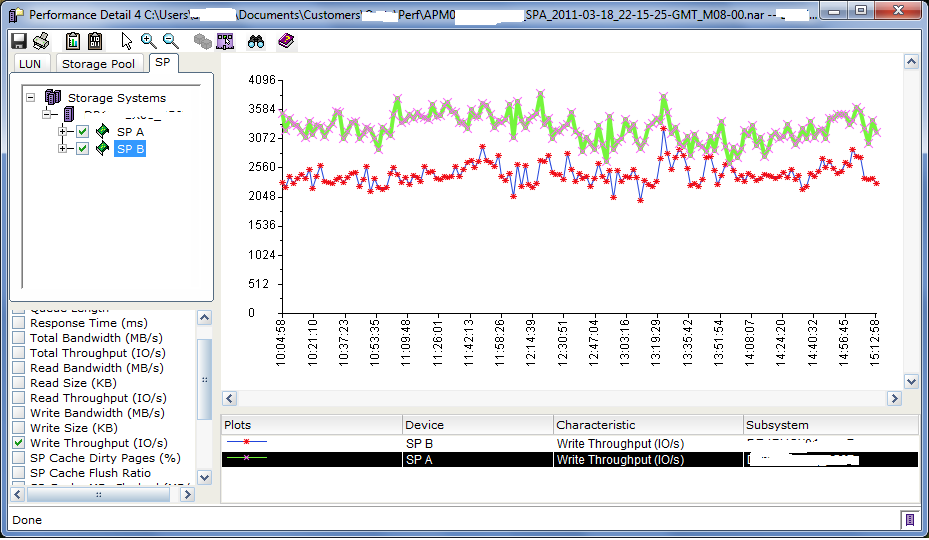
Another thing to look for is an imbalance of IO or Bandwidth on the processors.  Look specifically at Write Throughput and Write Bandwidth first as writes have the most impact on the storage system and more specifically the write cache.  As you can see in this graph, SPA is processing a fair bit more write IOPS compared to SPB.  This correlates with the high Dirty Pages and Response Time on SPA in the previous graphs.

So we’ve identified that there is performance degradation on SPA and that it is probably related to Write IO.  The next step is to dig down and find out if there are specific LUNs causing the high write load and see if those could be causing the high response times.

<< Back to Part 2 — Part 3 — Go to Part 4 >>

Performance Analysis for Clariion and VNX – Part 2

<< Back to Part 1 — Part 2 — Go to Part 3 >>

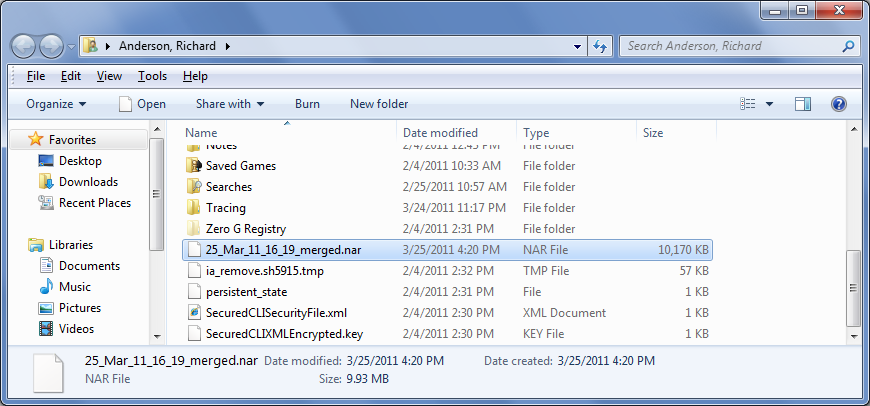
Okay, so you’ve got the Analyzer enabler on your array and enabled logging, and you’ve installed Unisphere Server, Unisphere Client, and Microsoft Excel on your workstation.  Next step is to download a NAR file from the array.  In Navisphere, right click on the array, go to the Analyzer menu and retrieve an archive.  You can get the archive from either SP of the array, both have the same data.  You will eventually see multiple NAR files, each covering some period of time.  Retrieve the one for the period of time you want to look at.  You can also merge multiple files together to get larger time periods into a single analyzer session.  In Unisphere, the process is essentially the same, select the array, go to Monitoring -> Analyzer.

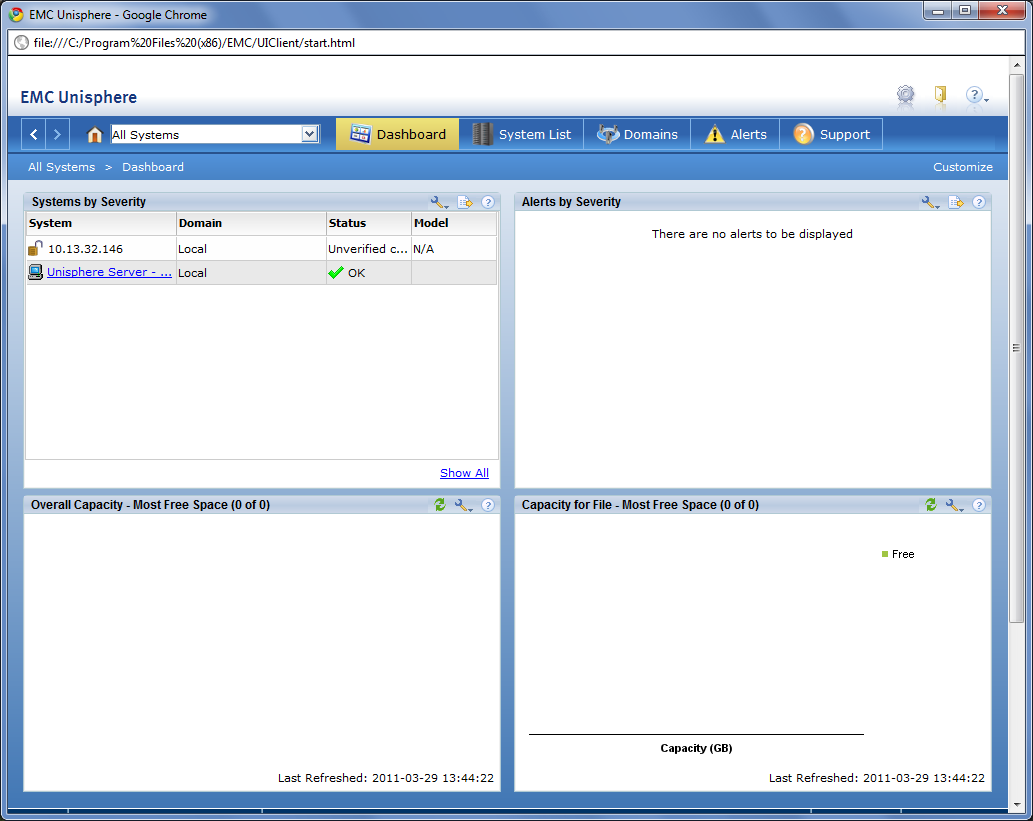
You’ve got your workstation set up and you have a NAR file downloaded to your workstation.  Let’s get to it.  Launch Unisphere Client from the Start Menu and connect to “localhost” when prompted.  Login to Unisphere.  You’ll see something like this…

In the drop down menu change to the “Unisphere Server – 127.0.0.1” which will change the main screen to Event Notification most likely.  Click on Monitoring, then Analyzer.

Let’s set some defaults before we open a NAR file.

  1. In the left pane, click Customize Charts
    1. In the General Tab, check the Advanced box so we can see more detailed metrics in Analyzer
    2. In the Archive Tab, under Analyzer, select Performance Detail and make sure Initially Check All Tree Objects is unchecked.
  1. Click OK to save.

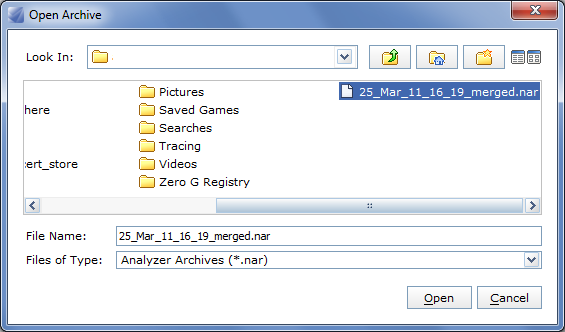
In the right pane, click on Open Archive , browse to the NAR file you want to view and open.

Because the NAR file can contain many hours (sometimes multiple days) or performance data, you will be prompted to set a time range.  The default times will show all data available in the archive.  If you want to narrow down to a smaller time range, change the Graph Start and End times, otherwise just click OK.

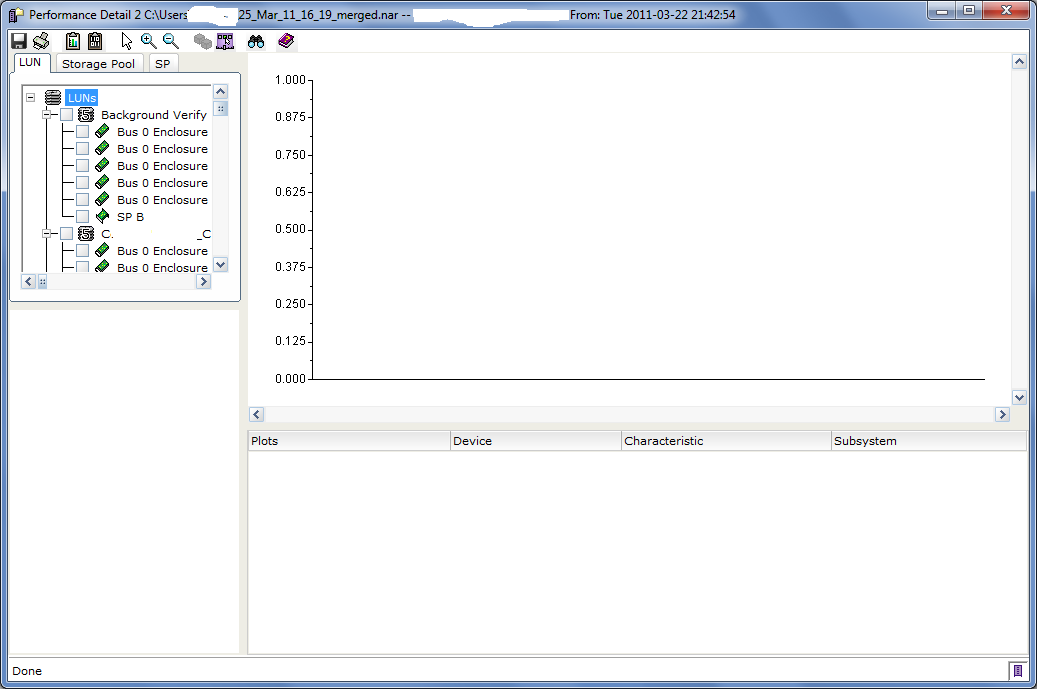
The Performance Detail window will launch and the LUN tab will be selected.  No items should be selected and as such no data will be graphed.

My personal methodology is to take a top-down approach when it comes to performance analysis and troubleshooting.

  • Check the SP’s, Cache, and SP Ports for obvious issues.  If a user is complaining of poor performance the Cache is usually the first place I look.
  • Drill down to RAID Groups, Pools, and LUNs to find the culprits
  • Drill down to the physical disk level if necessary
  • Export data to Excel for better graphs that make it easier to see whats happening

<< Back to Part 1 — Part 2 — Go to Part 3 >>

Performance Analysis for Clariion and VNX – Part 1

Posted on by
Part 1 — Go to Part 2 >>
  • Do you have an application owner complaining about performance?
  • Do you want to get a general idea of how your array is performing?
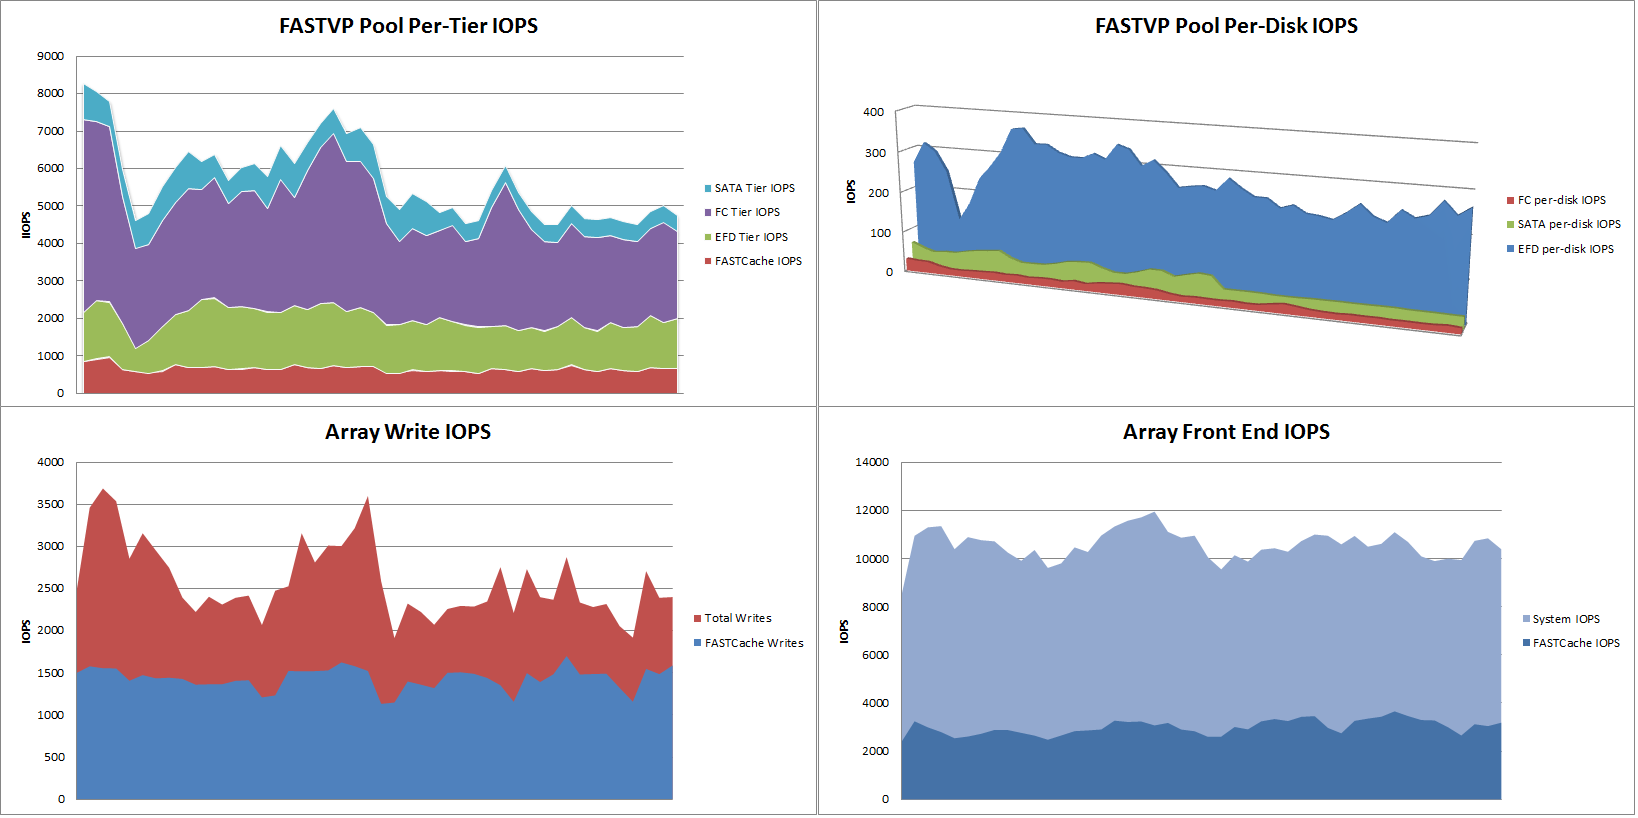
  • Do you want to turn this.. into this..?

I’ve been doing a lot of performance analysis with EMC Clariion CX3, CX4, and VNX storage recently and have a sort of an informal methodology I follow.  I’ve had a couple customers ask me to show them how to get useful data and graphs from their arrays and more recently after posting about FASTCache and FASTVP results I’ve had even more queries on the topic.  So I’ve decided to put together a sort of how-to guide.  It will take several posts to go through the whole process, so this first post will focus on making sure you have the right tools. The Tools: First, you MUST have the Navisphere/Unisphere Analyzer enabler on the storage array.  If you don’t have it, all you can really do is send an encrypted archive to EMC for help when you have a performance problem.  Analyzer is an indispensable performance analysis tool for CX/VNX systems and is really quite powerful.  Unfortunately, many customers don’t see the value during the purchase process but end up needing it someday in the future.  Make sure Analyzer is included in EVERY array purchase.

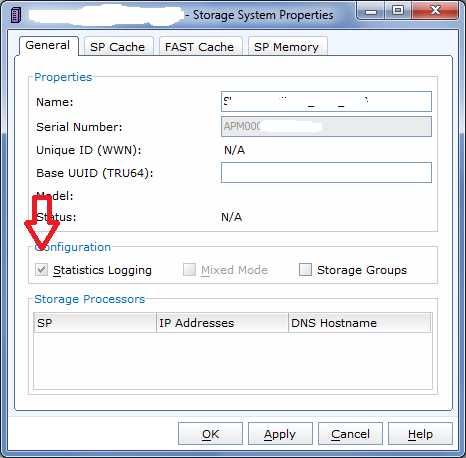
If you haven’t already, you also need to enable Statistics on the array AND in more recent versions of FLARE you need to enable Archive Logging.  Statistics logging is enabled in the array properties dialog, shown here…

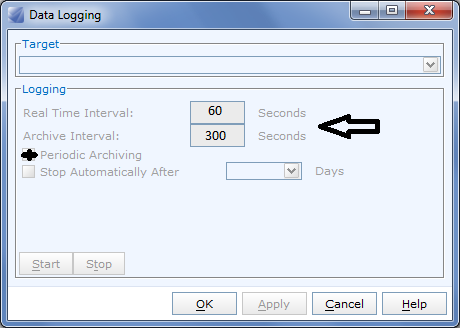
Archive Logging is enabled in the Monitoring -> Analyzer -> Data Logging dialog, shown here…

In practice, 5 minutes is a good interval for archives.  Also make sure that periodic archiving is enabled which will generate a new NAR file every so often (it depends on the interval)

Next, you need an Analyzer workstation.  You can run Analyzer directly off an array through Navisphere Manager or Unisphere but I prefer installing the software directly on my PC.  It lets me work on the analysis from home or anywhere else, and since I look at data from many different customer’s arrays’ it’s easier.  You can download the latest version of Unisphere Server and Unisphere Client directly from PowerLink (Home > Support > Software Downloads and Licensing > Downloads T-Z > Unisphere Server Software).  Once you install both, you can launch the client and log in to your local Unisphere server.   You can then open Analyzer archive files (NAR files) from any array for analysis. Third, you need a graphing tool.  I currently use Microsoft Excel 2010 on the same workstation as my Unisphere installation, which happens to be my corporate laptop.  While Analyzer does graph the data you select, there is only one type of graph available and sometimes when many objects are being graphed together it’s almost impossible to actually compare them to each other.

Another reason to use Excel is that while Analyzer has a wealth of different statistics available for all sorts of array objects, there are some exceptions right now.  For example, if you are using newer features such as FASTCache or FASTVP on your array and want to see statistics for those technologies, there is not much in Analyzer to see.  I’ll go through some methods for teasing that data out as well.

Part 1 — Go to Part 2 >>