Tag Archives: efficiency

StorageSavvy is going green! I see the light!

Posted on by 1 comment

Through a series of discussions with a friend who was evaluating solar for his home, doing some calculations, and discussing with the local contractor, I bit the bullet last month and got a 9800 watt solar array installed on our house here in the Pacific Northwest.  While pricey up front there are a number of incentives available from the Federal government as well as Washington State that effectively pay for the entire system.  I’ll write-up the cost analysis later but for now let’s take a look at the performance of the system..

Version 2The roof of our house has 4 sides with trees lining the entire East side of the property, causing some shading in the morning.  The majority of the North and South sides are clear and the West side is completely open.  Due to this, the 35 x 280 watt panels cover pretty much the entire West roof and a large portion of the South roof.  Our system uses the more expensive micro-inverters in order to handle shading of a single panel without affecting the rest of the system.  Aside from more efficiency in shading situations, the micro-inverters have about double the life of the less-expensive in-line inverters.  Our system is also grid-tied and we do not have any batteries involved.  Since the micro-inverters push 240VAC power down from the roof, the interconnection with our panel is very simple.  In order to take advantage of Washington State’s solar incentive the local power utility (Puget Sound Energy) installed a “Production Meter” that measures how many kWh’s the system generates irrespective of how it gets used.  And in order to take advantage of the grid-tied solar system to reduce my power bill they installed a new digital “Net Meter” that tracks both how much power I consume from the grid and how much our system pushes TO the grid.  The difference between those numbers determines the actual billed amount each month.

For example, if we push 1000 kWh into the grid during the month, and pull 900 kWh, then our bill that month will show a credit equal to 100 kWh.  That credit can be used in a later month (ie: the winter months) when we might be consuming more than we generate each day.

At about 7pm PT today pulled statistics from the micro-inverters as well as the current readings on the ‘net’ and ‘production’ meters.  The system came online during the morning of May 29th.  The cumulative numbers for the past ~12 days are as follows..

  • Production Meter
    • 580 kWh‘s generated by the solar array
  • Net Meter
    • 378 kWh‘s pushed to the grid
    • 205 kWh‘s consumed from the grid

Doing the math, this means we’ve consumed approximately 387 kWh in that time from all sources (grid + solar).  The summer has pretty much started here so at least for this time of year we are clearly generating significantly more that we consume.  The winter months will be different of course.  This also translates to a 173 kWh credit on our electric bill so far.

Let’s take a look at how the system performs on different days and at different times of day..

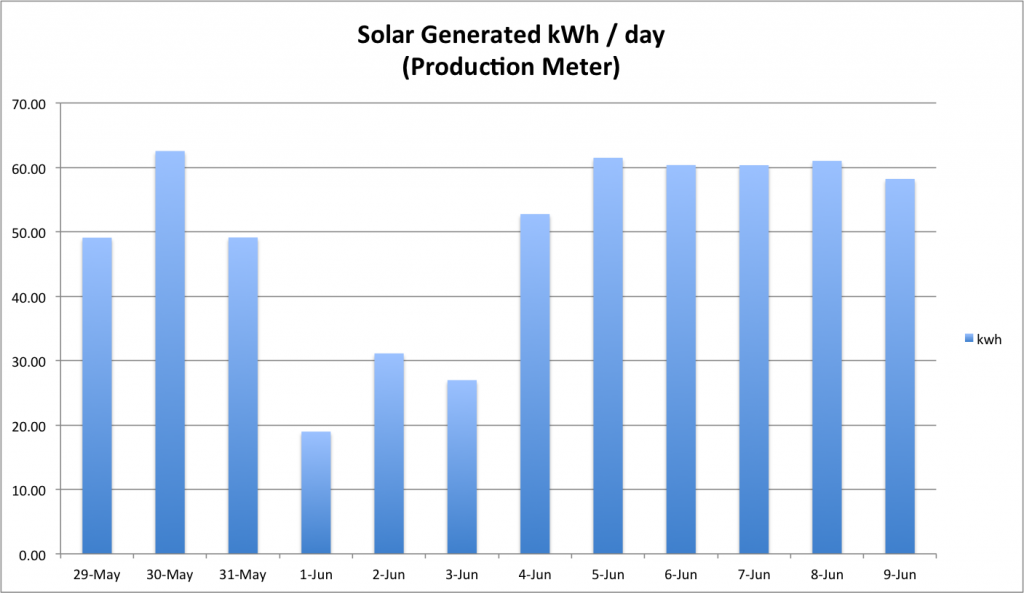
First, here is a look at how many kWh’s we are generating per-day.  You will see that there are some stormy, rainy, cloudy, dark days mixed in with the other more sunny days..

kwh-per-day-solar

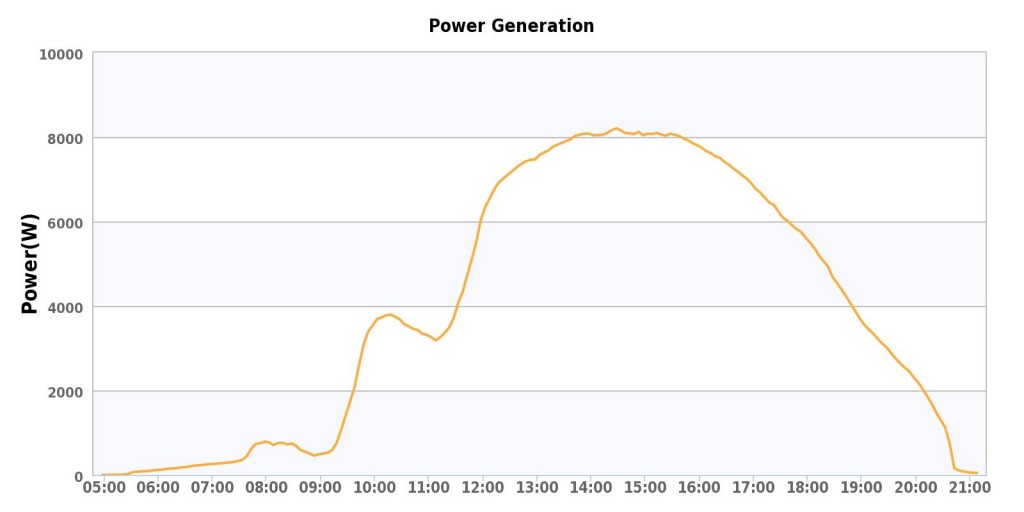
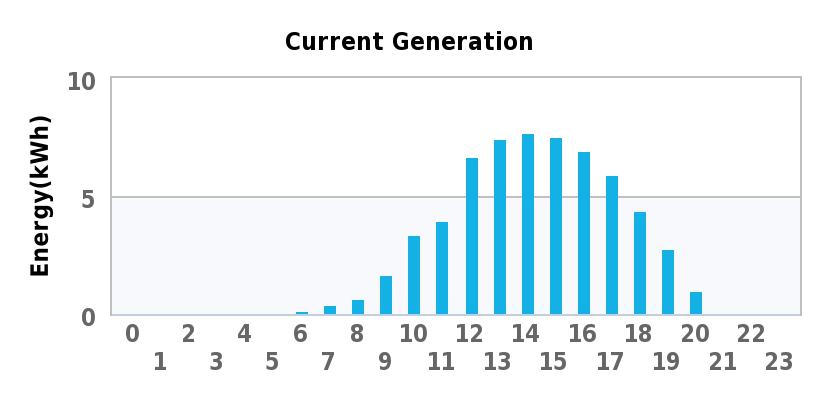
Now here are two charts, the first showing the amount of power being generated in watts through a 24 hour period on a nice sunny day and the second showing the number of kWh’s generated in each particular hour.

watts-24hours-sunny

You may notice the dips around 9am and 11am.  These are caused by the south side panels being partially shaded at those times as the sun moves across the sky.
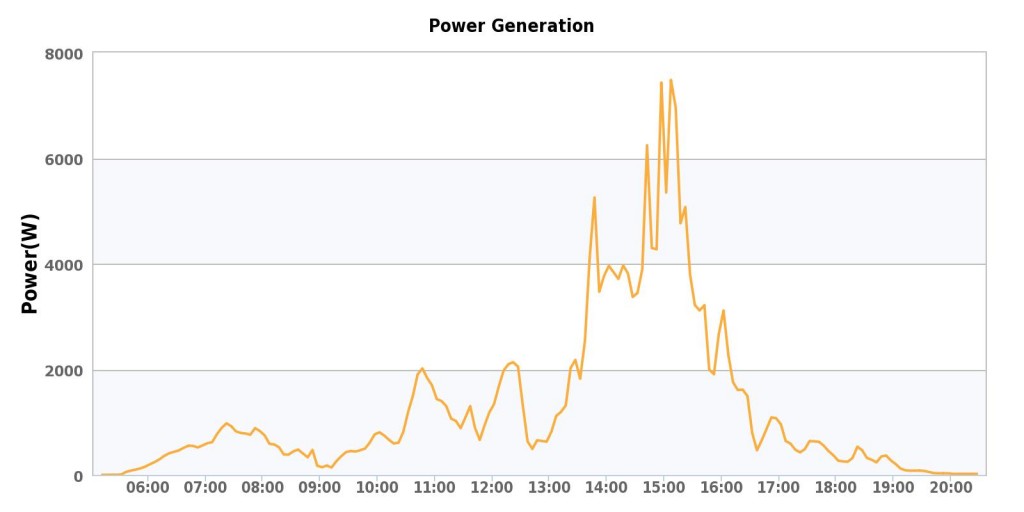
kwh-per-hour-sunnyHere are the same two charts for the darkest, cloudiest, rainiest day we had a quite a while.

watts-24hours-rainy

As the clouds and rain change through the day, you can see that the power generated is all over the place.  I was impressed that we still achieve over 7000 watts mid-afternoon on that day, if even for a short time.
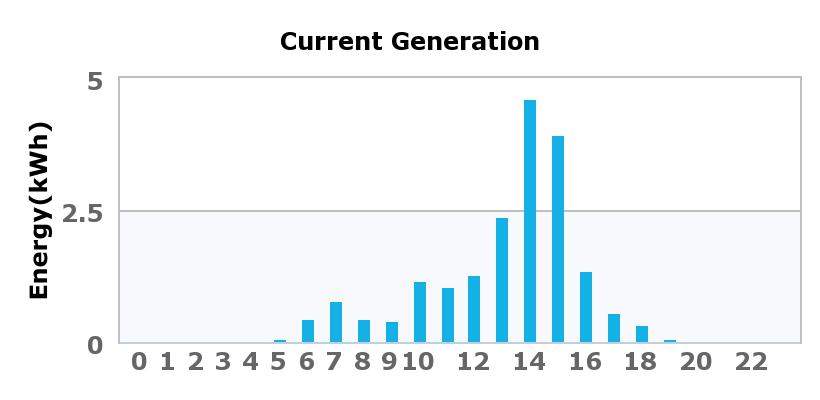
kwh-per-hour-rainyWhen you consider that there are comparably few days this bad in a given year, and we still generated about 75% of our average daily consumption rate, things are looking pretty good for an overall annual low electric bill.

All in all pretty promising — and we recently leased a new all-electric BMW i3 which we charge about once every 3 days.  That charging activity is included in all the above numbers so we are essentially powering the i3 entirely from the sun.  On the flip side, our house contains probably 50 x 65w can lights of which only a few have been converted to LED so far.  We could certainly reduce our power consumption a bit more if we converted more of our lighting to LED.  But there is a cost to that of course and it’s a long-term project.  Assuming our annual out-of-pocket electric cost ends up being zero, there’s really no ROI on replacing our bulbs with LED before the existing bulbs fail on their own.

More on this project later.


Real World EMC FASTVP and FASTCache results!

Posted on by

I have a customer who just recently upgraded their EMC Celerra NS480 Unified Storage Array (based on Clariion CX4-480) to FLARE30 and enabled FASTCache across the array, as well as FASTVP automated tiering for a large amount of their block data.  Now that it’s been configured and the customer has performed a large amount of non-disruptive migrations of data from older RAID groups and VP pools into the newer FASTVP pool, including thick-to-thin conversions, I was able to get some performance data from their array and thought I’d share these results.

This is Real-World data

This is NOT some edge case where the customer’s workload is perfect for FASTCache and FASTVP and it’s also NOT a crazy configuration that would cost an arm and a leg.  This is a real production system running in a customer datacenter, with a few EFDs split between FASTCache and FASTVP and some SATA to augment capacity in the pool for their existing FC based LUNS.  These are REAL results that show how FASTVP has distributed the IO workload across all available disks and how a relatively small amount of FASTCache is absorbing a decent percentage of the total array workload.

This NS480 array has nearly 480 drives in total and has approximately 28TB of block data (I only counted consumed data on the thin LUNs) and about 100TB of NAS data.  Out of the 28TB of block LUNs, 20TB is in Virtual Pools, 14TB of which is in a single FASTVP Pool.  This array supports the customers’ ERP application, entire VMWare environment, SQL databases, and NAS shares simultaneously.

In this case FASTCache has been configured with just 183GB of usable capacity (4 x 100GB EFD disks) for the entire storage array (128TB of data) and is enabled for all LUNs and Pools.  The graphs here are from a 4 hour window of time after the very FIRST FASTVP re-allocation completed using only about 1 days’ worth of statistics.  Subsequent re-allocations in the FASTVP pool will tune the array even more.

FASTCache

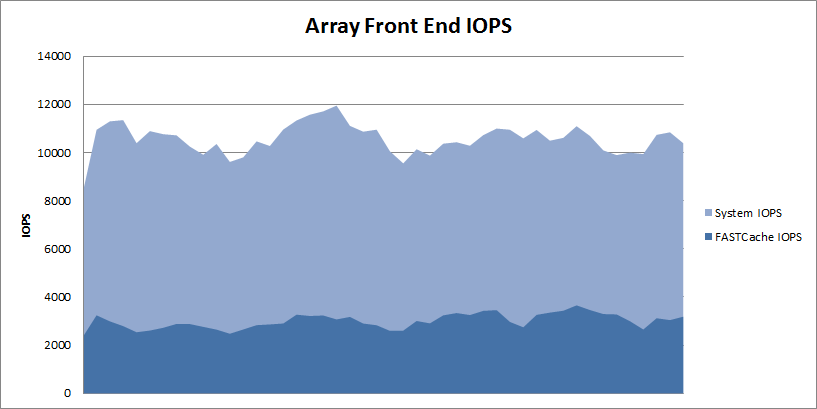
First, let’s take a look at the array as a whole, here you can see that the array is processing approximately ~10,000 IOPS through the entire interval.

FASTCache is handling about 25% of the entire workload with just 4 disks.  I didn’t graph it here but the total array IO Response time through this window is averaging 2.5 ms.  The pools and RAID Groups on this array are almost all RAID5 and the read/write ratio averages 60/40 which is a bit write heavy for RAID5 environments, generally speaking.

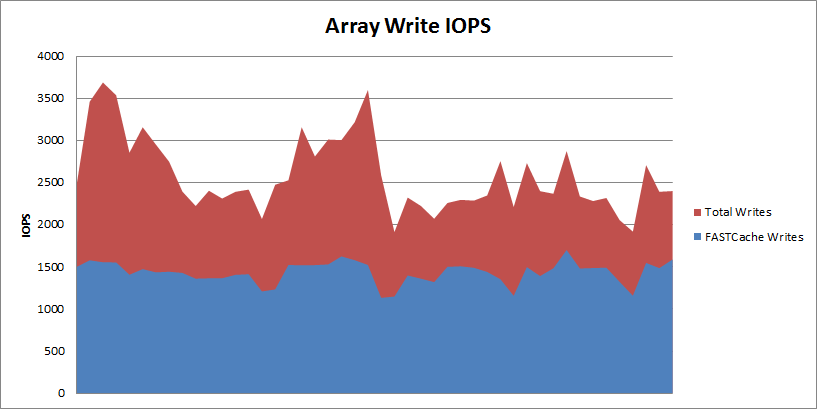
If you’ve done any reading about EMC FASTCache, you probably know that it is a read/write cache.  Let’s take a look at the write load of the array and see how much of that write load FASTCache is handling.  In the following graph you can see that out of the ~10,000 total IOPS, the array is averaging about 2500-3500 write IOPS with FASTCache handling about 1500 of that total.

That means FASTCache is reducing the back-end writes to disk by about 50% on this system.  On the NS480/CX4-480, FASTCache can be configured with up to 800GB usable capacity, so this array could see higher overall performance if needed by augmenting FASTCache further.  Installing and upgrading FASTCache is non-disruptive so you can start with a small amount and upgrade later if needed.

FASTVP and FASTCache Together

Next, we’ll drill down to the FASTVP pool which contains 190 total disks (5 x EFD, 170 x FC, and 15 x SATA).  There is no maximum number of drives in a Virtual Pool on FLARE30 so this pool could easily be much larger if desired.  I’ve graphed the IOPS-per-tier as well as the FASTCache IOPS associated with just this pool in a stacked graph to give an idea of total throughput for the pool as well as the individual tiers.

The pool is servicing between 5,000 and 8,000 IOPS on average which is about half of the total array workload.  In case you didn’t already know, FASTVP and FASTCache work together to make sure that data is not duplicated in EFDs.  If data has been promoted to the EFD tier in a pool, it will not be promoted to FASTCache, and vise-versa.  As a result of this intelligence, FASTCache acceleration is additive to an EFD-enabled FASTVP pool.   Here you can see that the EFD tier and FASTCache combined are servicing about 25-40% of the total workload, the FC tier another 40-50%, and the SATA tier services the remaining IOPS.  Keep in mind that FASTCache is accelerating IO for other Pools and RAID Group LUNs in addition to this one, so it’s not dedicated to just this pool (although that is configurable.)

FASTVP IO Distribution

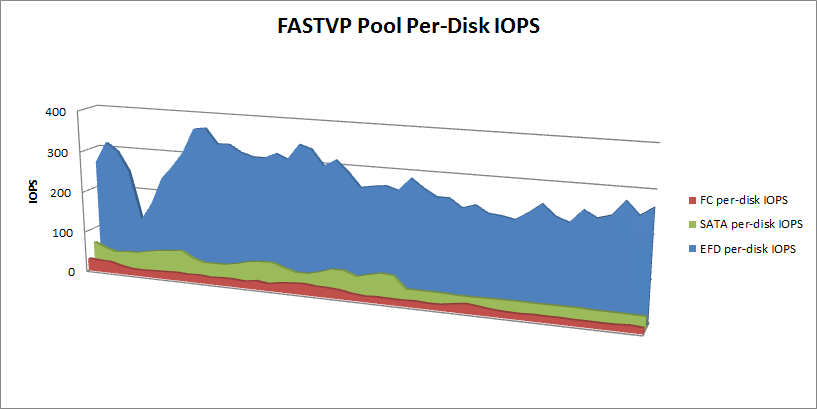
Lastly, to illustrate FASTVP’s effect on IO distribution at the physical disk layer, I’ve broken down IOPS-per-spindle-per-tier for this pool as well.  You can see that the FC disks are servicing relatively low IO and have plenty of head room available while the EFD disks, also not being stretched to their limits, are servicing vastly more IOPS per spindle, as expected.  The other thing you may have noticed here is that the EFDs are seeing the majority of the workload’s volatility, while the FC and SATA disks have a pretty flat workload over time.  This illustrates that FASTVP has placed the more bursty workloads on EFD where they can be serviced more effectively.

Hopefully you can see here how a very small amount of EFDs used with both FASTCache and FASTVP can relieve a significant portion of the workload from the rest of the disks.  FASTCache on this system adds up to only 0.14% of the total data set size and the EFD tier in the FASTVP pool only accounts for 2.6% of the total dataset in that pool.

What do you think of these results?  Have you added FASTCache and/or FASTVP to your array?  If so, what were your results?

Can you Compress AND Dedupe? It Depends

Posted on by

My recent post about Compression vs Dedupe, which was sparked by Vaughn’s blog post about NetApp’s new compression feature, got me thinking more about the use of de-duplication and compression at the same time.  Can they work together?  What is the resulting effect on storage space savings?  What if we throw encryption of data into the mix as well?

What is Data De-Duplication?

De-duplication in the data storage context is a technology that finds duplicate patterns of data in chunks of blocks (sized from 4-128KB or so depending on implementation), stores each unique pattern only once, and uses reference pointers in order to reconstruct the original data when needed.  The net effect is a reduction in the amount of physical disk space consumed.

What is Data Compression?

Compression finds very small patterns in data (down to just a couple bytes or even bits at a time in some cases) and replaces those patterns with representative patterns that consume fewer bytes than the original pattern.  An extremely simple example would be replacing 1000 x “0”s with “0-1000”, reducing 1000 bytes to only 6.

Compression works on a more micro level, where de-duplication takes a slighty more macro view of the data.

What is Data Encryption?

In a very basic sense, encryption is a more advanced version of compression.  Rather than compare the original data to itself, encryption uses an input (a key) to compute new patterns from the original patterns, making the data impossible to understand if it is read without the matching key.

Encryption and Compression break De-Duplication

One of the interesting things about most compression and encryption algorithms is that if you run the same source data through an algorithm multiple times, the resulting encrypted/compressed data will be different each time.  This means that even if the source data has repeating patterns, the compressed and/or encrypted version of that data most likely does not.  So if you are using a technology that looks for repeating patterns of bytes in fairly large chunks 4-128KB, such as data de-duplication, compression and encryption both reduce the space savings significantly if not completely.

I see this problem a lot in backup environments with DataDomain customers.  When a customer encrypts or compresses the backup data before it gets through the backup application and into the DataDomain appliance, the space savings drops and many times the customer becomes frustrated by what they perceive as a failing technology.  A really common example is using Oracle RMAN or using SQL LightSpeed to compress database dumps prior to backing up with a traditional backup product (such as NetWorker or NetBackup).

Sure LightSpeed will compress the dump 95%, but every subsequent dump of the same database is unique data to a de-duplication engine and you will get little if any benefit from de-duplication.   If you leave the dump uncompressed, the de-duplication engine will find common patterns across multiple dumps and will usually achieve higher overall savings.  This gets even more important when you are trying to replicate backups over the WAN, since de-duplication also reduces replication traffic.

It all depends on the order

The truth is you CAN use de-duplication with compression, and even encryption.  They key is the order in which the data is processed by each algorithm.  Essentially, de-duplication must come first.  After data is processed by de-duplication, there is enough data in the resulting 4-128KB blocks to be compressed, and the resulting compressed data can be encrypted.  Similar to de-duplication, compression will have lackluster results with encrypted data, so encrypt last.

Original Data -> De-Dupe -> Compress -> Encrypt -> Store

There are good examples of this already;

EMC DataDomain – After incoming data has been de-duplicated, the DataDomain appliance compresses the blocks using a standard algorithm.  If you look at statistics on an average DDR appliance you’ll see 1.5-2X compression on top of the de-duplication savings.  DataDomain also offers an encryption option that encrypts the filesystem and does not affect the de-duplication or compression ratios achieved.

EMC Celerra NAS – Celerra De-Duplication combines single instance store with file level compression.  First, the Celerra hashes the files to find any duplicates, then removes the duplicates, replacing them with a pointer.  Then the remaining files are compressed.  If Celerra compressed the files first, the hash process would not be able to find duplicate files.

So what’s up with NetApp’s numbers?

Back to my earlier post on Dedupe vs. Compression; what is the deal with NetApp’s dedupe+compression numbers being mostly the same as with compression alone?  Well, I don’t know all of the details about the implementation of compression in ONTAP 8.0.1, but based on what I’ve been able to find, compression could be happening before de-duplication.  This would easily explain the storage savings graph that Vaughn provided in his blog.  Also, NetApp claims that ONTAP compression is inline, and we already know that ONTAP de-duplication is a post-process technology.  This suggests that compression is occurring during the initial writes, while de-duplication is coming along after the fact looking for duplicate 4KB blocks.  Maybe the de-duplication engine in ONTAP uncompresses the 4KB block before checking for duplicates but that would seem to increase CPU overhead on the filer unnecessarily.

Encryption before or after de-duplication/compression – What about compliance?

I make a recommendation here to encrypt data last, ie: after all data-reduction technologies have been applied.  However, the caveat is that for some customers, with some data, this is simply not possible.  If you must encrypt data end-to-end for compliance or business/national security reasons, then by all means, do it.  The unfortunate byproduct of that requirement is that you may get very little space savings on that data from de-duplication both in primary storage and in a backup environment.  This also affects WAN bandwidth when replicating since encrypted data is difficult to compress and accelerate as well.