<< Back to Part 4 — Part 5 — Go to Part 6 >>
Sorry for the delay on this next post.. Between EMC World and my 9 month old, it’s been a battle for time…
Okay, so you have an EMC Unified storage system (Clariion, Celerra, or VNX) with FASTCache and you’re wondering how FASTCache is helping you. Today I’m going to walk you through how to tease FASTCache performance data out of Analyzer.
I’m assuming you already have Analyzer launched and opened a NAR archive. One thing to understand about Analyzer stats as they relate to FASTCache, is that stats are gathered at the LUN level for traditional RAID Group LUNs, but for Pool based LUNs, the stats are gathered at the pool level. As a result graphing data for FASTCache differs for the two scenarios.
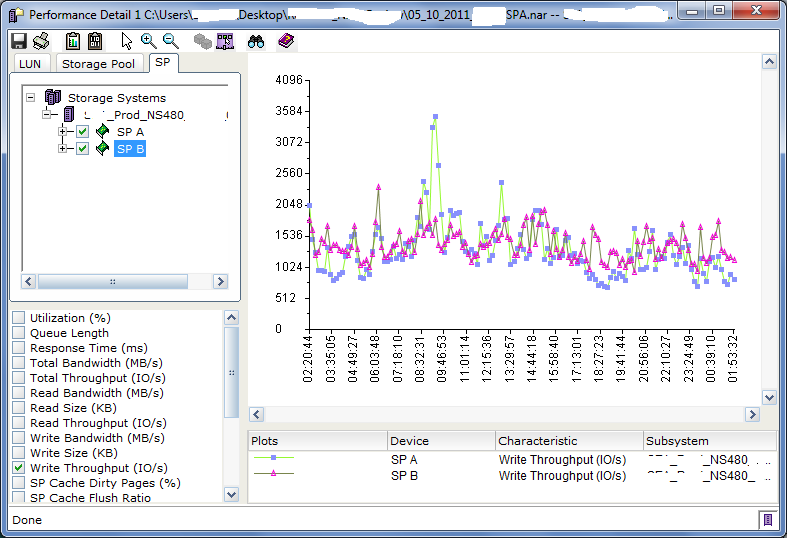
First we’ll take a look at the overall array performance. Here we’ll see how much of the write workload is being handled by FASTCache. In the SP Tab of Analyzer, select both SPs (be sure no LUNs or other objects are selected). Select Write Throughput (IO/s), and then click the clipboard icon (with I’s and O’s).![]()
Launch Microsoft Excel and paste into the sheet, and then perform the text-to-column change discussed in the previous post if necessary.
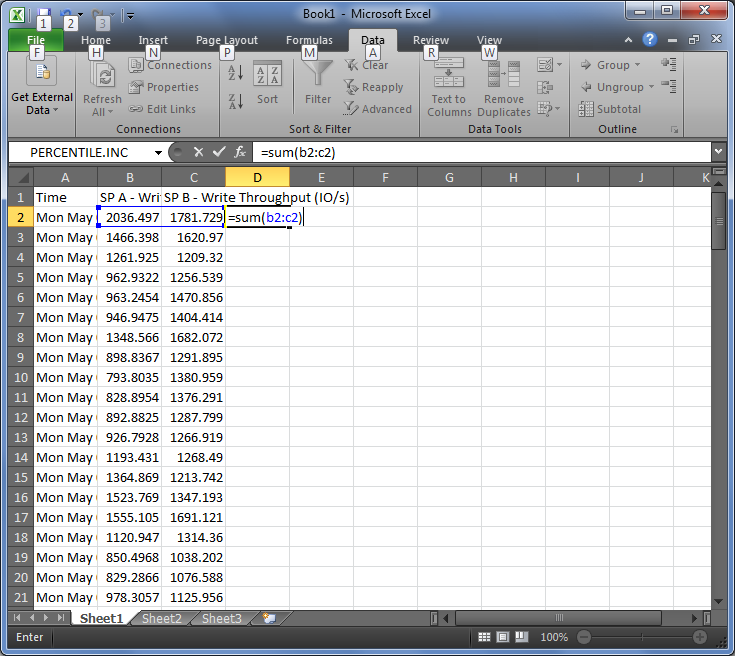
Next create a formula in the D column, adding the values for both SPs into a single total. We’re not going to graph it quite yet though.
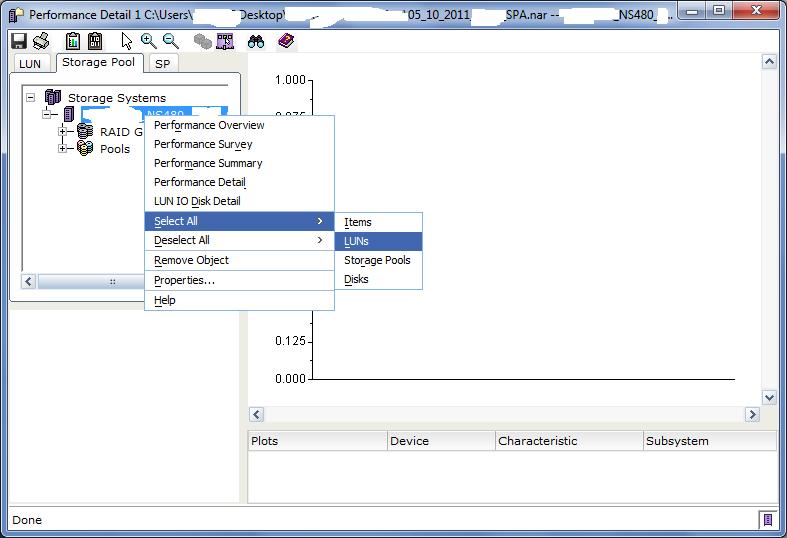
Back in Analyzer, deselect the two SPs, switch to the Storage Pool Tab, right-click on the array and choose Select All -> LUNs, then Select All -> Pools.
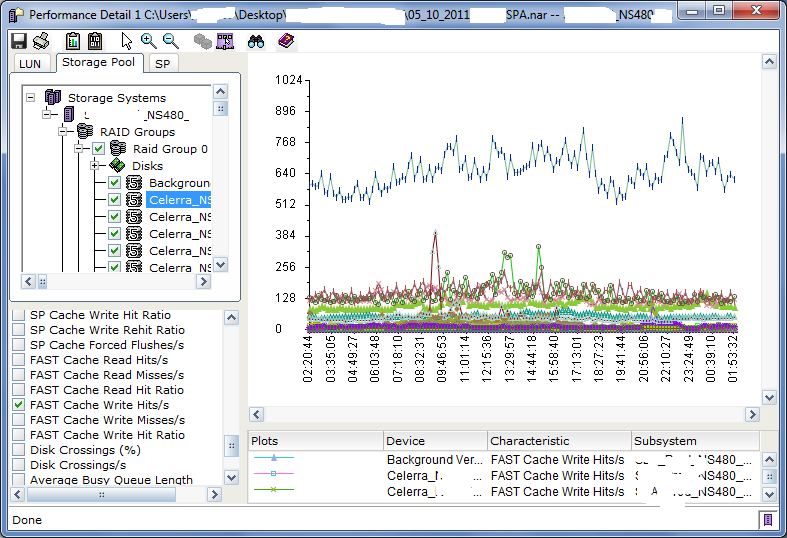
Click on a RAID Group LUN or Pool in the tree, it doesn’t matter which one, deselect Write Throughput (IO/s) and select FAST Cache Write Hits/s. In a moment, you’ll end up with a graph like this.
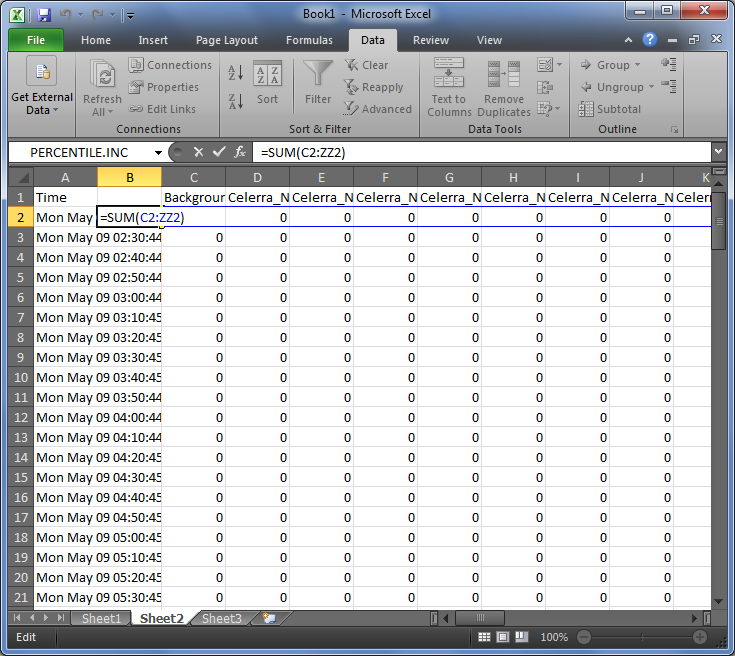
Click the clipboard icon again to copy this data and paste it into a new sheet of the same workbook in Excel. Insert a blank column between column A and B, then create a formula to add the values from column B through ZZ (ie: =SUM(C2:ZZ2).
Then copy that formula and paste into every row of column B. This column will be our Total FAST Cache Write Hits for the whole array. Finally, click the header for Column B to select it, then copy (CTRL-C). Back to the first sheet — Paste the “Values” (123 Icon) into Column E.
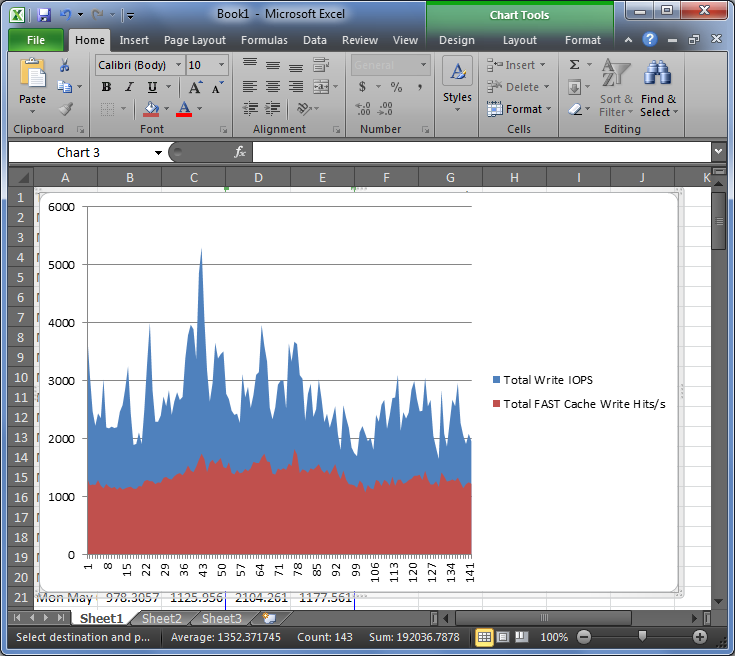
Now that we have the Total Write IOPS and Total FAST Cache Write Hits in adjacent columns of the same worksheet, we can graph them together. Select both columns (D and E in my example), click Insert, and choose 2D Area Chart. You’ll get a nice little graph that looks something like the following.
Since it’s a 2D Area Chart, and not a stacked graph, the FASTCache Write IOPS are layered over the Total Write IOPS such that visually it shows the portion of total IOPS handled by FASTCache. Follow this same process again for Read Throughput and FASTCache Read Hits. Furthur manipulation in Excel will allow you to look at total IOPS (read and write) or drill down to individual Pools or RAID Group LUNs.
Another thing to note when looking at FASTCache stats… FAST Cache Misses are IOPS that were not handled by FASTCache, but they may still have been handled by SP Cache. So in order to get a feel for how many read IOs are actually hitting the disks, you’d actually want to subtract SP Read Cache Hits and Total FASTCache Read Hits (calculated similar to the above example) from SP Read Throughput. This is similar for Write Cache Misses as well.
I hope this helps you better understand your FASTCache workload. I’ll be working on FASTVP next, which is quite a bit more involved.
<< Back to Part 4 — Part 5 — Go to Part 6 >>

Mimmus
May 25, 2011 at 1:56 am
I’m not able to see Fast Cache (nor SP Cache) statistics, only the most common ones 🙁
Why?
storagesavvy
May 25, 2011 at 10:15 am
There are two possible reasons..
1.) If you have highlighed a LUN that is in a pool, these options won’t be shown, you’ll need to select a traditional LUN (from a RAID group) or the pool itself.


2.) The Advanced option is not enabled. I mentioned it in part 2, you need to go into the Customize Charts option from the Monitoring -> Analyzer page of Unisphere and check the “Advanced” box.
Mimmus
May 27, 2011 at 3:12 am
Solved! Thank you
rallystar
July 8, 2011 at 12:44 pm
When I do this I get different rollup periods for the SP data than for the pool data. SP data looks like every 20 mins and Pool data every 5 mins.
Andrew
July 22, 2011 at 11:59 am
Just wanted to say – absolutely awesome series of posts, I wish I’d come across them before! Thanks very much for sharing your obviously outstanding expertise with us, I for one appreciate it very much.
storagesavvy
July 22, 2011 at 5:45 pm
Thanks for linking and the kind words!
js
August 2, 2011 at 3:37 pm
Thank you so much for the awesome article!
I’m relatively green to the storage world, and this is priceless information to me. I’m not one of those administrator that will oversize our infrastructure just to compensate for incompetence and lack of analysis skills. You will help me achieve that 😀 Thanks!!!
jimmy
August 31, 2011 at 10:09 am
Hey storagesavvy,
I am in the process of trying to determine if my EMC CX3-10 is capable of handling our IO load. Our unit is Fibre attached and has the SATAII disks. We are thinking of replacing this unit with a Netapp FAS2040 with 1TB SATAII disks but not sure it will perform as well as the CX3-10.
I am a little confused on how to determine if I am bottlenecked or close to it. Performance seems to be ok as I have no complaints thus far but we are expecting to increase workload with new projects soon. As I have understood from reading in the past, the IOPS that a single SATAII drive can provide is usually between 70 and 90 IOPS. Since the EMC CX3-10 has the disks bundled into 5 disk RAID5 groups my assumption was that the max IOPS I could get per RAID group would be under 400. However looking at my Read Throughput (IO/s)are near 4000 for some Luns. The Write Throughput (IO/s) looks close to what should be expected. My initial thought is that the high Read IO numbers are due to read caching. Do you have any hard numbers for any counters I can go off of to determine performance issues? I know all situations are different as you stated but just trying to get my head around this.
Thanks
storagesavvy
September 1, 2011 at 1:21 am
If you want to send me a NAR file, I’ll take a look at it.
Andrew
September 7, 2011 at 10:58 am
These are fantastic posts and much appreciated. I wonder if you could share your opinion on best practice for LUN creation?
Here’s where I am struggling to decide best practice – we are heavy VMware users. Let’s say I want to create 3 x 500GB LUNs for VMware – so pretty much random data access as each of these LUNs is going to have perhaps 5 VM’s on.
let’s assume I have a bunch of unused 146Gb 15K drives. Am I better off (from an overall performance perspective) to create one large RAID group and then split that into 3 LUNs, or 3 individual RAID groups with one LUN on each?
With the first scenario I’d have more spindles overall so could have a higher peak throughput if one LUN has spikey usage, but at the same time, with the second scenario I’d have more consistent performance per LUN as heavy use of one would have less impact on the others.
Just wondering what your thoughts are.
Thanks in advance
Andrew
P.S. Although I’ve posted this after your fast-cache blog post, I don’t currently have fast-cache on CX4 in question!
storagesavvy
September 11, 2011 at 1:30 pm
These are fantastic posts and much appreciated
Thanks!!
Let’s say I want to create 3 x 500GB LUNs for VMware – so pretty much random data access as each of these LUNs is going to have perhaps 5 VM’s on.
Am I better off (from an overall performance perspective) to create one large RAID group and then split that into 3 LUNs, or 3 individual RAID groups with one LUN on each?
This is a common question and there is no perfect answer. However, In typical VMWare environments, I would tend to go with more/smaller LUNs and stripe them wide across all of the spindles vs. dedicating RAID groups to each LUN. There are several reasons.
That said, in my prior role, I had very good success building many VMFS datastores on the same spindles using MetaLUNs. In your example, rather than creating 1 RAID Group, create 3 RAID Groups, then build MetaLUNs across all 3 RAID Groups, such that all 3 LUNs are sharing all of the spindles. This will drive better parallelism at the disk level and higher throughput. I believe a RAID5 4+1 group with 146GB drives has about 534GB usable. If you create 3 MetaLUNs, they could actually be about 534GB each, making the individual component LUNs 178GB each.
To get even more IO queues, you could use spanned VMFS datastores across multiple LUNs. In that case, you’d create 6 MetaLUNs of about 267GB each and then create spanned VMFS datastores across two at a time to create 3 x 534GB datastores. Each Datastore ends up with 2 IO queues that way, This isn’t all that necessary due to the size of the LUNs and the number of VMs involved, but if you had very large datastores, which many VMs, you may want to consider this.
Hope that helps!
Gary
March 8, 2012 at 9:22 am
Hi storagesavvy,
Thansk for the blog, keep it up as i find it extremely useful. I do however have a query regarding how i can determine how much cache and spindles to provide to an application?
I was asked to analyse why a vmware environment was experiencing performance issues and they believed the CX4 to be the issue.
I could see straight away that the cache was forced flushing at every 10 minutes.. and that several LUNs had around 2000 IOPS just below their peak. The workload was random writes across the board.
I ran Analyser and took the Read and Write IOPS over a few days, dumped them into excel, got the 95 percentile and caclulated the amount of spindles for both R5 and R10 in order to cope with the workload.
I migrated the problem LUNs into dedicated R10 storage pools which provided adequate spindles and I could see then that although the Write IO was still at around 2000 IOPS this was no longer having an effect on the cache..
I have noticed that all these LUNs although have the same RAID (10), same spindles, same workload they never peak above 2000 IOPS.. I am wondering is this due to the ceiling here due to the amount of disks they have been provided.. if i were to double the disks, would they run at up to 4000 IOPs???
I suppose my question is, how can i determine how many spindles to provide the application so that I can give provide adequate disks for throughput.. i do not know at present whether 2000 IOPS is sufficient or whether it would reach 10000 IOPS.
How do you know what spindle count to give the applcation when you dont truely know the workload ceiling??
Sorry if this is confusing.. it is confusing me !!
Smoulpy
April 6, 2012 at 6:49 am
Hey ^^
Thanks a lot for this topics ^^
I’ve a question about disk performance (throughput) it seems we can’t have more than 30Mo/s for each disk 10K Rpm or 15K Rpm regarding the best practices of EMC. Is it a good value for designing a lun who need like 200MB/s ? (like 8 disques in a raid)
Thank you so much
aboutn
December 12, 2012 at 12:10 am
Thank you for the fantastic posts, they are extremely useful. Do you have any plans for the Part 6 aka FAST VP analysis?
Storage Guy
February 18, 2013 at 3:48 am
Awesome article. When’s part 6?
George D
May 12, 2013 at 12:28 pm
looking forward to part 6, especially how to schedule this to run and export periodically.
Igor Abzalov
August 19, 2013 at 4:17 pm
So, where is Part 6 ?
talismania
December 2, 2013 at 3:42 am
Put me on the list of people that would love to see you continue this topic.