<< Back to Part 3 — Part 4 — Go to Part 5 >>
Making Lemonade from Lemons.
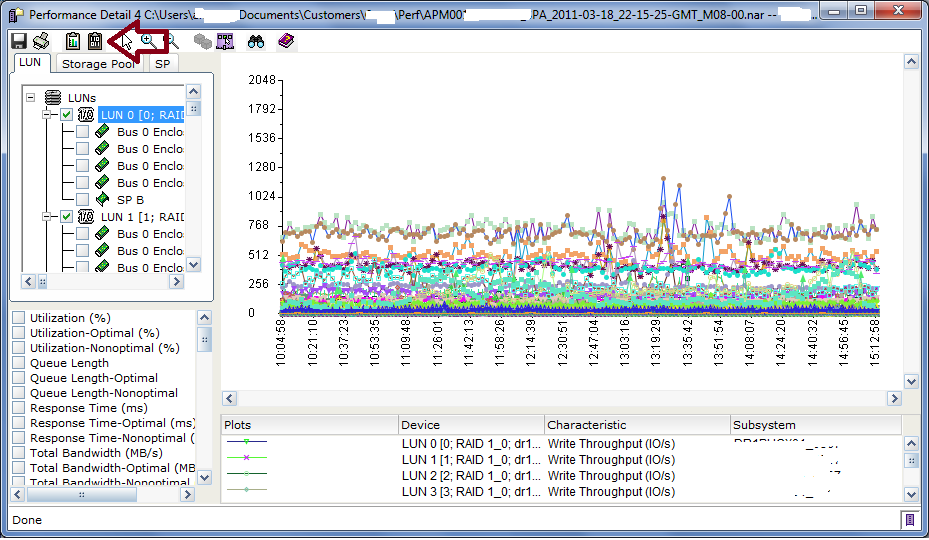
In the last post, we looked at the storage processor statistics to check for cache health, excessive queuing, and response time issues and found that SPA has some performance degradation which seems to be related to write IO. Now we need to drill down on the individual LUNs to see where that IO is being directed. This is done in the LUN tab of Analyzer. First, right click on the storage array itself in the left pane and choose deselect all -> items. Then click the LUN tab and right click on the top level of the tree “LUNs”, choose select all -> LUNs. Click on one of the LUNs to highlight it, then in choose Write Throughput (IO/s) from the bottom pane. It may take a second for Analyzer to render the graph but you’ll end up with something like this…
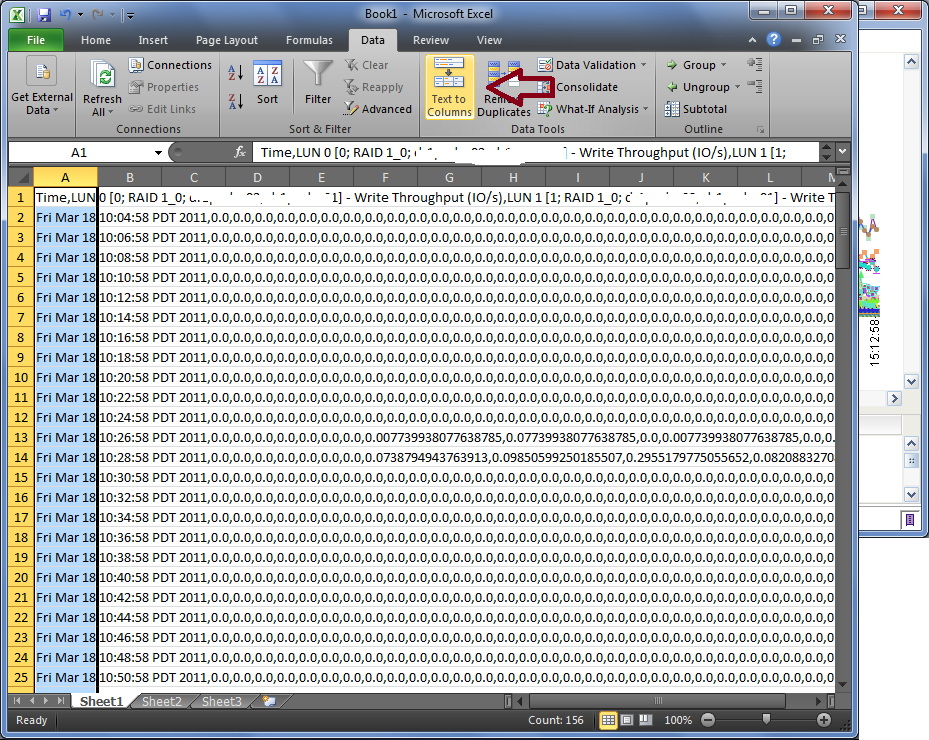
You’ll quickly realize that this view doesn’t really help you figure out what’s going on. With many LUNs, there is simply too much data to display it this way. So click the clipboard button that has the I’s and O’s in it (next to the red arrow) to copy the graph data (in CSV format) into your desktop clipboard. Now launch Microsoft Excel, select cell A1 and type Ctrl-V to paste the data. It will look like the following image at first, with all LUNs statistics pasted into Column A.
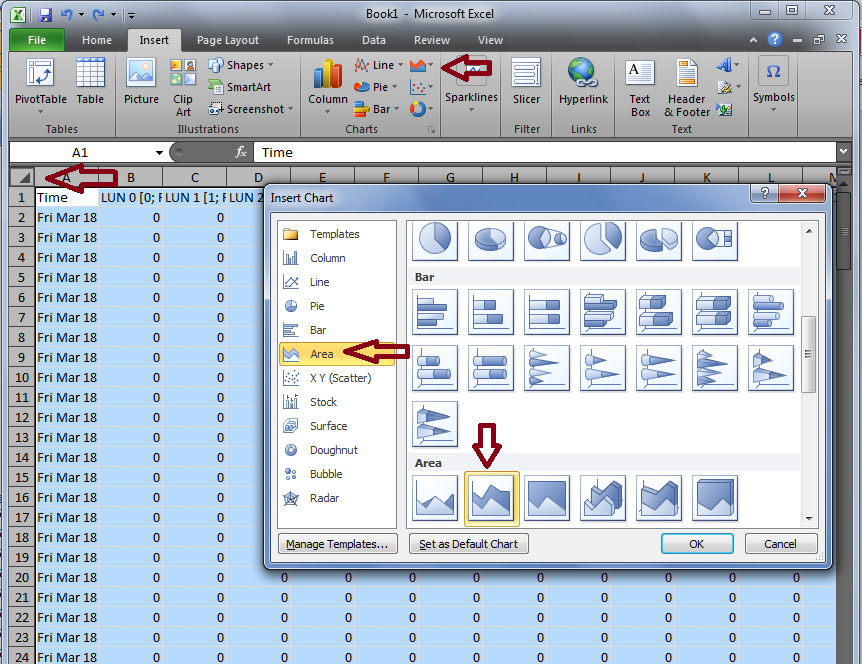
Now we need to break out the various metrics into their own columns to make meaningful data, so go to the Data menu and click Text to Columns (see red arrow above). Select Delimited, click Next.. Select ONLY comma as the delimiter, then next, next, finish. Excel will separate the data into many columns (one column per LUN). Next we’ll create a graph that can actually tell us something. First, click the triangle button at the upper left corner of the sheet to select all of the data in the sheet at once. Then click the area chart icon, select Area, then the Stacked Area (see Red Arrows below) icon. Click OK.
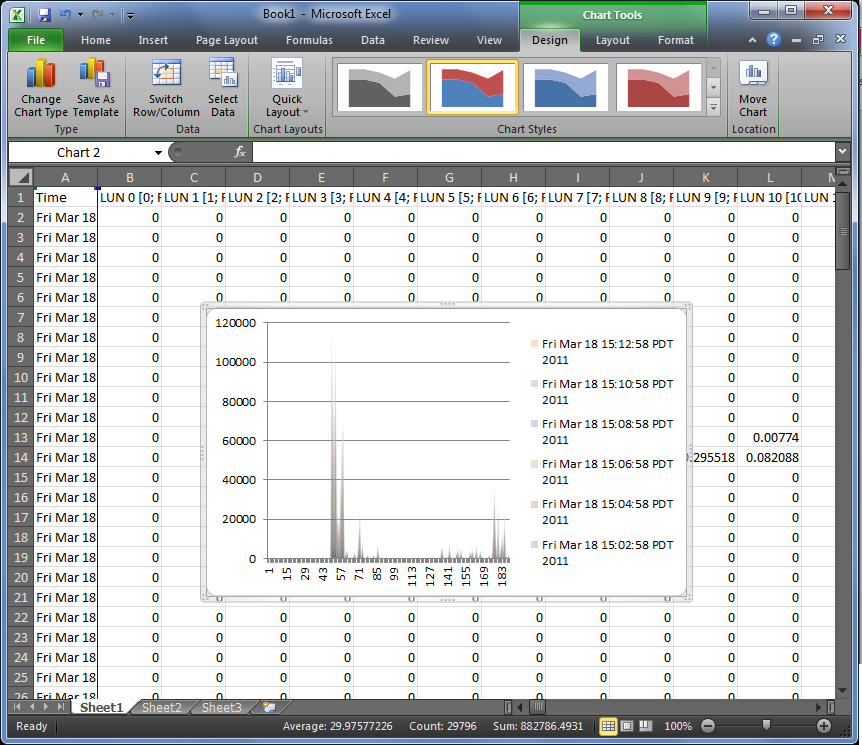
You’ll get a nice little graph like this one below that is completely useless because the default chart has the X and Y axis reversed from what we need for Analyzer data.
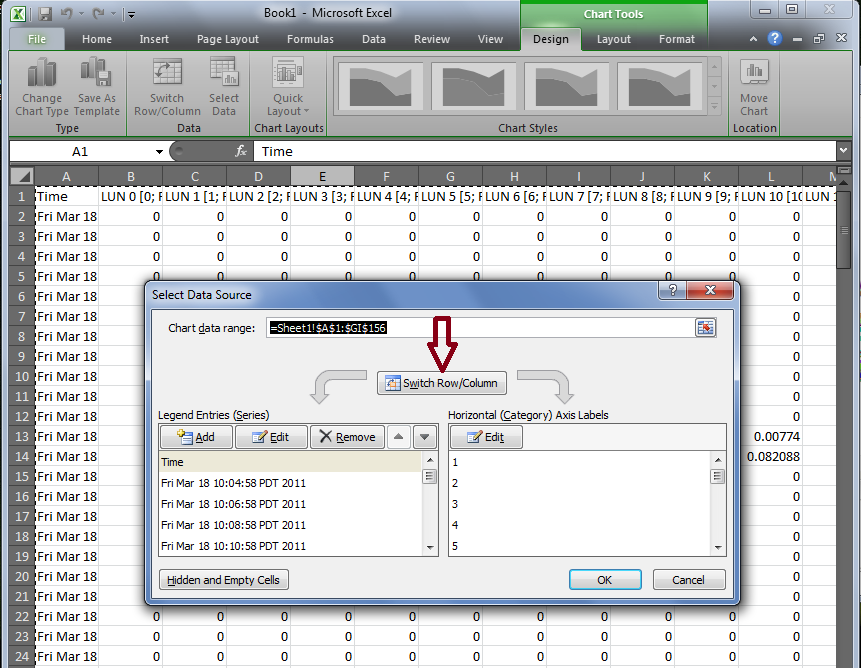
To Fix this, right click on the graph, choose “Select Data”, click the Switch row/column button, and click OK.
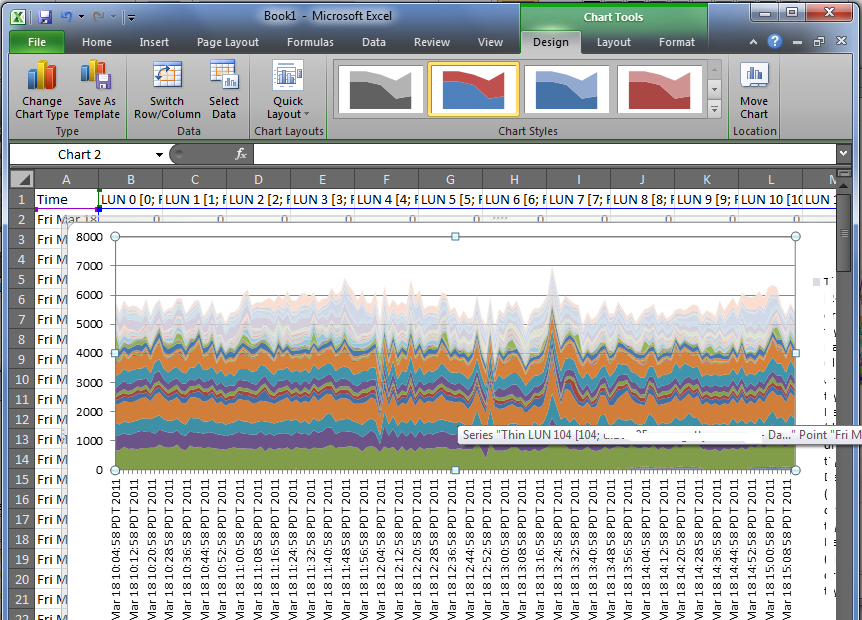
Now you have a useful graph like the one below. What we are seeing here is each band of color representing the Write IOPS for a particular LUN. You’ll note that about 6 LUNs have very thick bands, and the rest of the over 100 LUNs have very small bands. In this case, 6 LUNs are driving more than 50% of the total write IOPS on the array. Since the column header in the Excel sheet has the LUN data, you can mouse over the color band to see which LUN it represents.
Now that you know where to look, you can go back to Analyzer, deselect all LUNs and drill down to the individual LUNs you need to look at. You may also want to look at the hosts that are using the busy LUNs to see what they are doing. In Analyzer, check the Write IO Size for the LUNs you are interested in and see if the size is in line with your expectations for the application involved. Very large IO sizes coupled with high IOPS (ie: high bandwidth) may cause write cache contention. In the case of this particular array, these 6 LUNs are VMFS datastores, and based on the Thin LUN space utilization and write IO loads, I would recommend that the customer convert them from Thin LUNs to Thick LUNs in the same Virtual Pool. Thick LUNs have better write performance and lower processor overhead compared with Thin LUNs and the amount of free space in these Thin LUNs is fairly small. This conversion can be done online with no host impact using LUN Migration.
You can use this copy/paste technique with Excel to graph all sorts of complex datasets from Analyzer that are pretty much not viewable with the default Analyzer graph. This process lets you select specific data or groups of metrics from an complete Analyzer archive and graph just the data you want, in the way you want to see it. There is also a way to do this as a bulk export/import, which can be scheduled too, and I’ll discuss that in the next post.
<< Back to Part 3 — Part 4 — Go to Part 5 >>

Performance Analysis for Clariion and VNX – Part 3 «
April 14, 2011 at 9:32 pm
[…] Performance Analysis for Clariion and VNX – Part 4 […]
Ian
May 4, 2011 at 9:40 am
Nice performance analysis breakdown. Shame EMC don’t give out detailed stuff like this. Look forward to your next post.
Performance Analysis for Clariion and VNX – Part 5 (FASTCache) «
May 24, 2011 at 6:01 am
[…] <> […]
equals42
May 2, 2012 at 10:50 am
“There is also a way to do this as a bulk export/import, which can be scheduled too, and I’ll discuss that in the next post.”
I’m looking forward to the scheduled export bit. It looks like you went on to FAST cache discussion and missed the bit teased at the end of this section.
Marty
December 26, 2012 at 8:49 am
The problem with comma delimited is that the LUN description includes host information with comma separated file systems. These are a pain to delete.
storagesavvy
December 27, 2012 at 4:18 pm
Hmm, I haven’t experienced that but I could see how it might happen. Maybe there’s a way to import/columnize the data taking that into account. I’d have to try it out.
Marty
December 28, 2012 at 8:22 am
Thanks a lot for this! It’s great to have this type of data available.
I’m thinking that I’m more interested in looking at throughput by RAID Group (or Storage Pool) rather than by LUN – after all isn’t the RAID group the limiting factor?
Why can we get throughput stats by RAID Group and not by Storage Pool?
Marty
December 28, 2012 at 12:08 pm
If we look at Write Throughput on a RAID Group – does that include the RAID penalty or do we need to add that into our analysis?
Marty
December 28, 2012 at 1:31 pm
Sorry – one more…
In memory cache, it generally holds that the data cached in L1 exists in L2, the data in L2 exists in L3, and the data in L3 exists in main memory.
Does the data residing in FAST cache also exist in the underlying disk system? At some point data promoted to FAST cache gets read from the the underlying disk system – will that I/O be registered in the NAR file? Doesn’t data written to FAST cache eventually get written to spinning disks, and do those writes get counted twice?
Hope this question makes sense…
Ron
February 25, 2013 at 11:38 am
Thanks some very handy data manipulation here!
andrewmephndrew
April 29, 2013 at 10:25 pm
A late reply but still, worth a try… I am a technical guy too – but from the DB world. I am working currently on a project that involves connecting Sparc T4-2 to VNX 5500 and dividing it for DB use in an optimal way. Can I venture a question? I did not really have a chance to analyze storage performance with NA/UA – which will be my next step, but I’m sure you will have useful tips on this.
I am struggling with an old dilemma: whether to place single DB devices on multiple small LUNs (say, given one RAID group), or to place multiple DB devices on the same large LUN(s). From the initial tests on OS/DB level, this seems to matter little to OS (see some data below). Storage, though, measures utilization/throughput on LUN level, so this must matter to some extent. Is it? Do you have some numbers?
Test 2: DB built in 22 seconds,
r/s w/s kr/s kw/s wait actv wsvc_t asvc_t %w %b device
0.0 833.5 0.0 106682.0 0.0 1.9 0.0 2.3 0 192 c5
0.0 248.0 0.0 31742.2 0.0 0.6 0.0 2.3 0 57 c5t500601603CE00A64d5
0.0 188.5 0.0 24126.6 0.0 0.4 0.0 2.3 0 44 c5t500601603CE00A64d4
0.0 205.5 0.0 26302.5 0.0 0.5 0.0 2.3 0 48 c5t500601603CE00A64d3
0.0 191.5 0.0 24510.6 0.0 0.4 0.0 2.3 0 43 c5t500601603CE00A64d1
0.0 835.0 0.0 106873.9 0.0 1.9 0.0 2.3 0 192 c8
0.0 171.0 0.0 21886.8 0.0 0.4 0.0 2.3 0 39 c8t500601613CE00A64d5
0.0 229.0 0.0 29310.3 0.0 0.5 0.0 2.3 0 53 c8t500601613CE00A64d4
0.0 204.0 0.0 26110.5 0.0 0.5 0.0 2.3 0 47 c8t500601613CE00A64d3
0.0 231.0 0.0 29566.3 0.0 0.5 0.0 2.3 0 53 c8t500601613CE00A64d1
Test 3: DB built in 23 seconds,
r/s w/s kr/s kw/s wait actv wsvc_t asvc_t %w %b device
0.0 831.9 0.0 106478.2 0.0 1.9 0.0 2.3 0 99 c5
0.0 831.8 0.0 106472.2 0.0 1.9 0.0 2.3 1 99 c5t500601603CE00A64d6
0.0 836.5 0.0 107069.0 0.0 1.9 0.0 2.3 0 99 c8
0.0 836.4 0.0 107065.3 0.0 1.9 0.0 2.3 1 99 c8t500601613CE00A64d6
Eve
June 29, 2013 at 1:28 pm
This was a great primer to storage analysis, thank you! One question: how did you overcome the 255 data limit in Excel? This limit prevents me from creating the chart described in this section.