<< Back to Part 2 — Part 3 — Go to Part 4 >>
Disclaimer: Performance Analysis is an art, not a science. Every array is different, every application is different, and every environment has a different mix of both. These posts are an attempt to get you started in looking at what the array is doing and pointing you in a direction to go about addressing a problem. Keep in mind, a healthy array for one customer could be a poorly performing array for a different customer. It all comes down to application requirements and workload. Large block IO tends to have higher response times vs. small block IO for example. Sequential IO also has a smaller benefit from (and sometimes can be hindered by) cache. High IOPS and/or Bandwidth is not a problem, in fact it is proof that your array is doing work for you. But understanding where the high IOPS are coming from and whether a particular portion of the IO is a problem is important. You will not be able to read these series of posts and immediately dive in and resolve a performance problem on your array. But after reading these, I hope you will be more comfortable looking at how the system is performing and when users complain about a performance problem, you will know where to start looking. If you have a major performance issue and need help, open an case.
Starting from the top…
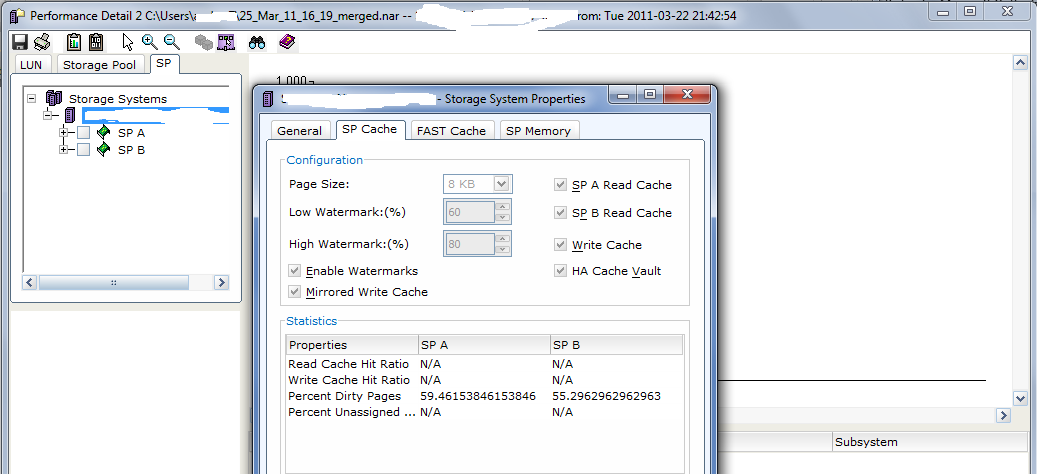
First let’s check the health of the front end processors and cache. The data for this is in the SP Tab which shows both of the SPs. The first thing I like to look at is the “SP Cache Dirty Pages (%)” but to make this data more meaningful we need to know what the write cache watermarks are set to. You can find this by right-clicking on the array object in the upper-left pane and choosing properties. The watermarks are shown in the SP Cache tab.
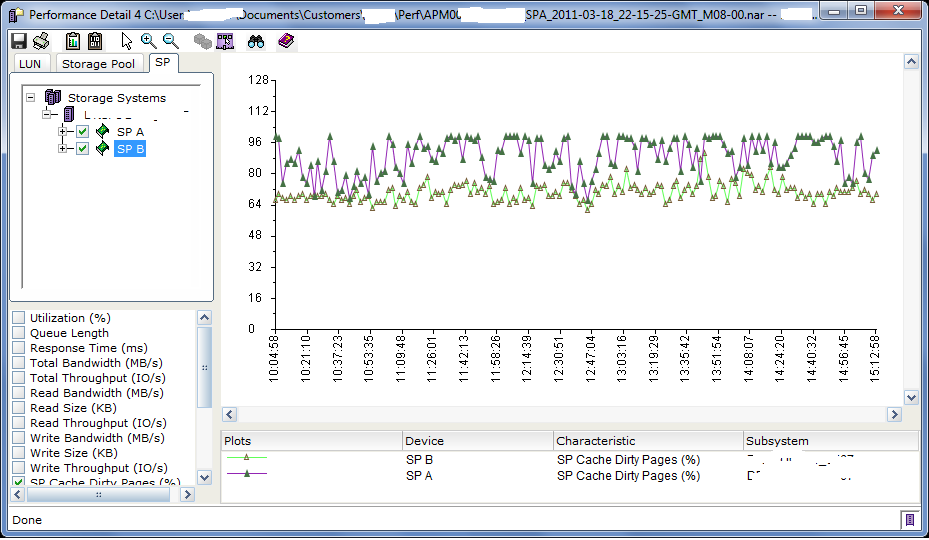
Once you note the watermarks, close the properties window and check the boxes for SPA and SPB. In the lower pane, deselect utilization and chose SP Cache Dirty Pages (%).
Dirty pages are pages in write cache that have received new data from hosts, but have not been flushed to disk. Generally speaking you want to have a high percentage of dirty pages because it increases the chance of a read coming from cache or additional writes to the same block of data being absorbed by the cache. Any time an IO is served from cache, the performance is better than if the data had to be retrieved from disk. This is why the default watermarks are usually around 60/80% or 70/90%.
What you don’t want is for dirty pages to reach 100%. If the write cache is healthy, you will see the dirty pages value fluctuating between the high and low watermarks (as SPB is doing in the graph). Periodic spikes or drops outside the watermarks are fine, but repeatedly hitting 100% indicates that the write cache is being stressed (SPA is having this issue on this system). The storage system compensates for a full cache by briefly delaying host IO and going into a forced flushing state. Forced Flushes are high priority operations to get data moved out of cache and onto the back end disks to free up write cache for more writes. This WILL cause performance degradation. Sustained Large Block Write IO is a common culprit here.
While we’re here, deselect Dirty Pages (%) and select Utilization (%) and look for two things here:
1.) Is either SP running at a load of higher than 70%? This will increase application response time. Check whether the SPs seem to fluctuate with the business day. For non-disruptive upgrades, both SPs need to be under 50% utilization.
2.) Are the two SPs balanced? If one is much busier than the other that may be something to investigate.
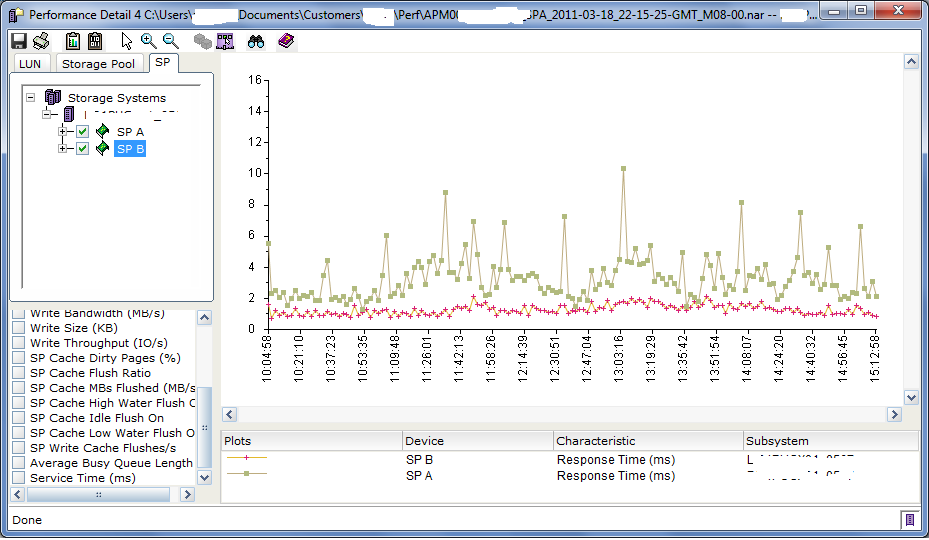
Now look at Response time (ms) and make sure that, again, both SPs are relatively even, and that Response time is within reasonable levels. If you see that one SP has high utilization and response time but the other SP does not, there may be a LUN or set of LUNs owned by the busy SP that are consuming more array resources. Looking at Total Throughput and Total Bandwidth can help confirm this, and then graphing Read vs. Write Throughput and Bandwidth to see what the IO operations actually are. If both SPs have relatively similar throughput but one SP has much higher bandwidth, then there is likely some large block IO occurring that you may want to track down.
As an example, I’ve now seen two different customers where a Microsoft Sharepoint server running in a virtual machine (on a VMFS datastore) had a stuck process that caused SQL to drive nearly 200MB/sec of disk bandwidth to the backend array. Not enough to cause huge issues, but enough to overdrive the disks in that LUN’s RAID Group, increasing queue length on the disks and SP, which in turn increased SP utilization and response time on the array. This increased response time affected other applications unrelated to Sharepoint.
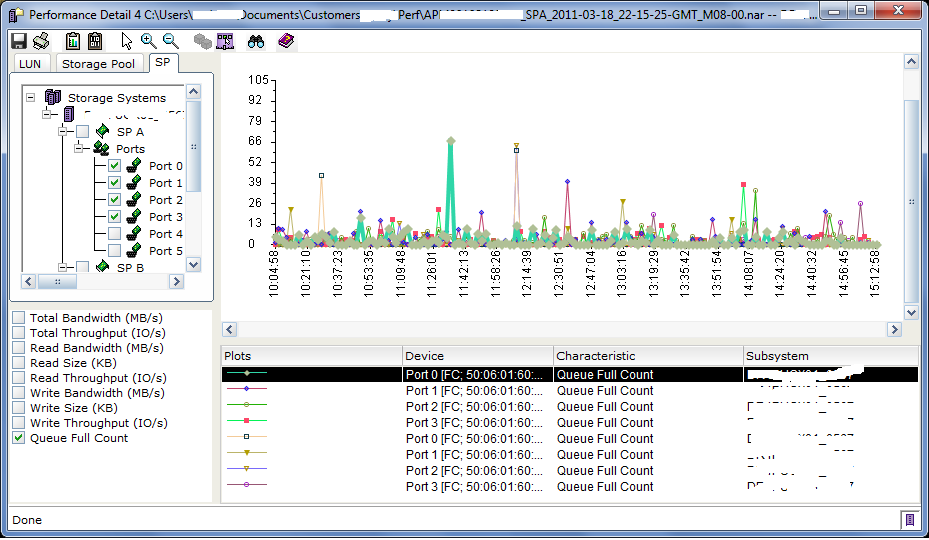
Next, let’s check the Port Queue Full Count. This is the number of times that a front end port issued a QFULL response back to the hosts. If you are seeing QFULL’s there are two possible causes.. One is that the Queue Depth on the HBA is too large for the LUNs being accessed. Each LUN on the array has a maximum queue depth that is calculated using a formula based on the number of data disks in the RAID Group. For example, a RAID5 4+1 LUN will have a queue depth of 88. Assuming your HBA queue depth is 64 then you won’t have a problem. However, if the LUN is used in a cluster file system (Oracle ASM, VMWare VMFS, etc) where multiple hosts are accessing the LUN simultaneously, you could run into problems here. Reducing the HBA Queue Depth on the hosts will alleviate this issue.
The second cause is when there are many hosts accessing the same front end ports and the HBA Execution Throttle is too large on those hosts. A Clariion/VNX front end port has a queue depth of 1600 which is the maximum number of simultaneous IO’s that port can process. If there are 1600 IOs in queue and another IO is issued, the port responds with QFULL. The host HBA responds by lowering its own Queue Depth (per LUN) to 1 and then gradually increasing the queue depth over time back to normal. An example situation might be 10 hosts, all driving lots of IO, with HBA Execution Throttle set to 255. It’s possible that those ten hosts can send a total of 2550 IOs simultaneously. If they are all driving that IO to the same front end port, that will flood the port queue. Reducing the HBA Execution throttle on the hosts will alleviate this issue.
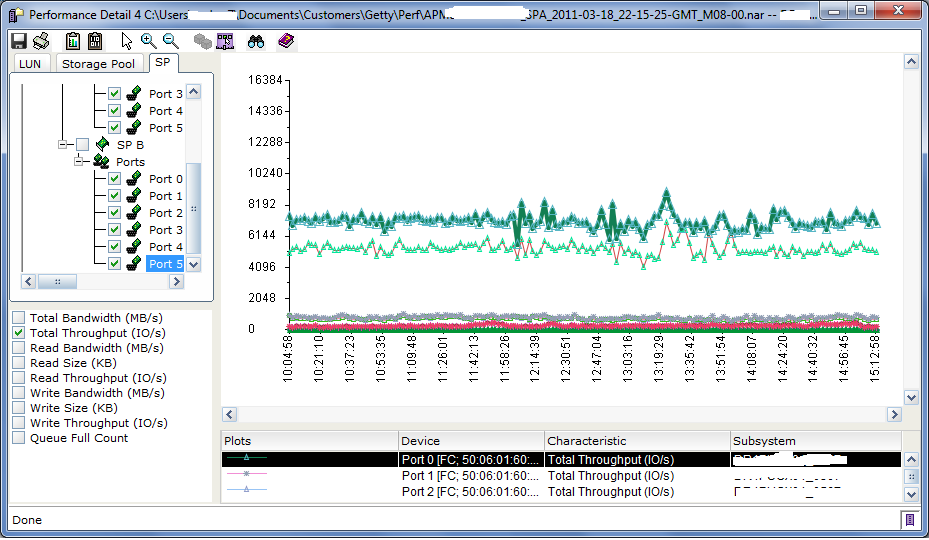
Looking at the Port Throughput, you can see here that 2 ports are driving the majority of the workload. This isn’t necessarily a problem by itself, but PowerPath could help spread the load across the ports which could potentially improve performance.
In VMWare environments specifically, it is very common to see many hosts all accessing many LUNs over only 1 or 2 paths even though there may be 4 or 8 paths available. This is due to the default path selection (lowest port) on boot. This could increase the chances of a QFULL problem as mentioned above or possibly exceeding the available bandwidth of the ports. You can manually change the paths on each LUN on each host in a VMWare cluster to balance the load, or use Round-Robin load balancing. PowerPath/VE automatically load balances the IO across all active paths with zero management overhead.
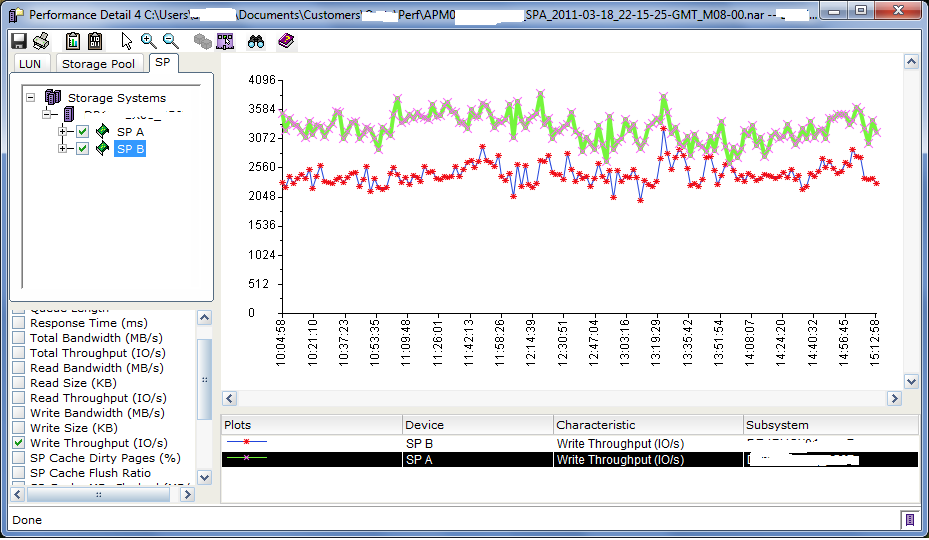
Another thing to look for is an imbalance of IO or Bandwidth on the processors. Look specifically at Write Throughput and Write Bandwidth first as writes have the most impact on the storage system and more specifically the write cache. As you can see in this graph, SPA is processing a fair bit more write IOPS compared to SPB. This correlates with the high Dirty Pages and Response Time on SPA in the previous graphs.
So we’ve identified that there is performance degradation on SPA and that it is probably related to Write IO. The next step is to dig down and find out if there are specific LUNs causing the high write load and see if those could be causing the high response times.
<< Back to Part 2 — Part 3 — Go to Part 4 >>

Performance Analysis for Clariion and VNX – Part 2 «
April 11, 2011 at 11:03 am
[…] << Back to Part 1 — Part 2 — Go to Part 3 >> […]
Menno de liege
April 14, 2011 at 10:23 am
Can i please receive part 4 and the following?
storagesavvy
April 14, 2011 at 10:44 am
I hope to have Part 4 done this week and posted. I’m creating them as I go.
Performance Analysis for Clariion and VNX – Part 4 «
April 14, 2011 at 9:31 pm
[…] << Back to Part 3 — Part 4 — Go to Part 5 >> […]
John
August 3, 2011 at 5:45 am
Hello,
Anyone would know why the “SP Cache Dirty Pages (%).” is not present in the bottom pane of the SP tab? Mind you, it’s a new installation.
Wikkie
August 22, 2011 at 3:20 am
Hi John,
Go to System -> Monitoring and Alerts -> Statistics.
At the left pane Settings there is a option >> Customize charts.
At the window choose the General tab, select here at “Characteristics (analyzer)” the option advanced.
Click ok and you good to go
John
August 24, 2011 at 10:09 am
Thank you so Much Wikkie, that worked!
Jeremy Bradshaw
November 30, 2012 at 11:19 am
Many many thanks for this guide and great job at answering the questions. You are helping people out here tremendously! This answer in particular helped me today.
storagesavvy
November 30, 2012 at 3:05 pm
Glad you found something useful!
BJP
May 29, 2012 at 4:30 pm
I hate to have to point this out to you, but…. If your average dirty page % count is continually above 50%, your array is essentially non-redundant. You cannot expect to survive an SP failure if one head is incapable of shouldering the caching burden of both SPs.
If your Clariion is only ocassionally spiking above 50% on dirty pages, that’s fine. The odds of a situation occuring that will swamp the SP are low. But if you’re routinely above 50, you’re in serious, serious trouble and need to move you watermarks (carefully) downward, in such a way that the average is consistently below 50.
We’ve had this happen where I work, and EMC was pretty much head-in-ass when asked about it. Between this, and the fact that CPU utilization is allowed to exceed 50% per SP makes this a potentially unstable/dangerous SAN if growth is not monitored closely over time.
storagesavvy
August 23, 2012 at 12:18 am
I think you may be confusing Dirty pages with SP Utilization. EMC Recommends keeping SP Utilization under 50% for best practices and under 70% for performance reasons. SP Utilization over 70% usually causes an increase in host response times. The under 50% recommendation is to guarantee that an SP Failure doesn’t cause a performance degradation, since the total load across both SP’s (when under 50%) won’t exceed the capability of a single SP. SP Utilization bouncing around between 50% and 70% is generally okay in part because some of the CPU Utilization on each SP is related to internal management processes that don’t fail over to the second SP (especially with CX3/CX4 hardware) rather than all of it being related to host IO.
As far as Dirty Pages goes, there is no correlation between dirty pages % and the ability to weather an SP failure. Write Cache is mirrored to both SPs, so if you have 4GB of total write cache, that 4GB exists on both SPs. Failing an SP just makes one mirror unavailable, the same amount of write cache is still available to hosts. Assuming the workload remains the same during the failure there should not be an effect on the write cache itself.
The watermarks determine how much uncommitted data is kept in cache. Leaving uncommitted data in cache for longer periods increases the chances that the data will be read back by the host in the future (coming from cache instead of the disks) and/or being overwritten by the host with new data (reducing the number of write’s to disk over time)
The ideal write cache watermark values are a compromise between having as high a watermark as possible (in order to keep more data in cache) while preventing bursts of writes to fill the cache completely (dirty pages 100%) which causes forced flushing. This is why EMC starts out at 60/80 and recommends lowering the watermarks only after performance problems are seen. Watermark values of 60/80 guarantees that, under normal circumstances, at least 20% of the total write cache is available for bursts of writes. If you lower the watermarks, you decrease your chances of a cache hit, which increases the amount of backend IO the array has to send to the disks.