<< Back to Part 1 — Part 2 — Go to Part 3 >>
Okay, so you’ve got the Analyzer enabler on your array and enabled logging, and you’ve installed Unisphere Server, Unisphere Client, and Microsoft Excel on your workstation. Next step is to download a NAR file from the array. In Navisphere, right click on the array, go to the Analyzer menu and retrieve an archive. You can get the archive from either SP of the array, both have the same data. You will eventually see multiple NAR files, each covering some period of time. Retrieve the one for the period of time you want to look at. You can also merge multiple files together to get larger time periods into a single analyzer session. In Unisphere, the process is essentially the same, select the array, go to Monitoring -> Analyzer.
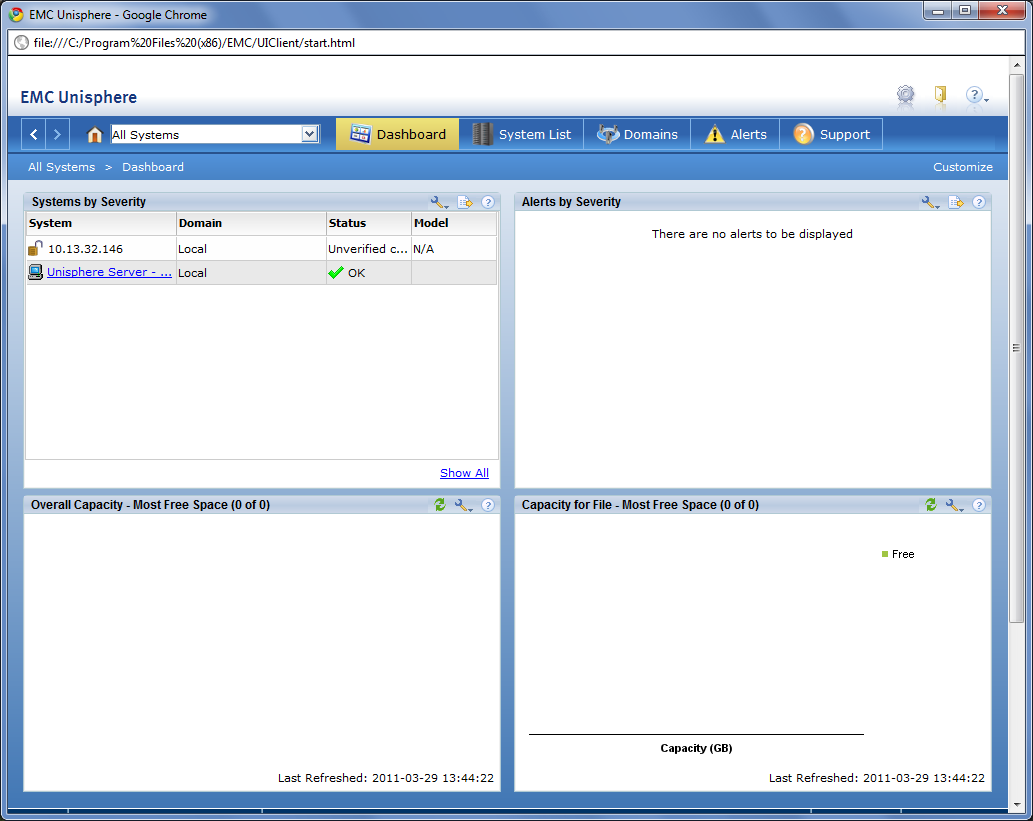
You’ve got your workstation set up and you have a NAR file downloaded to your workstation. Let’s get to it. Launch Unisphere Client from the Start Menu and connect to “localhost” when prompted. Login to Unisphere. You’ll see something like this…
In the drop down menu change to the “Unisphere Server – 127.0.0.1” which will change the main screen to Event Notification most likely. Click on Monitoring, then Analyzer.
Let’s set some defaults before we open a NAR file.
- In the left pane, click Customize Charts
- In the General Tab, check the Advanced box so we can see more detailed metrics in Analyzer
- In the Archive Tab, under Analyzer, select Performance Detail and make sure Initially Check All Tree Objects is unchecked.
- Click OK to save.
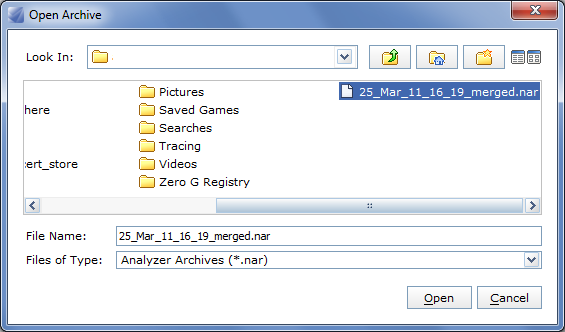
In the right pane, click on Open Archive , browse to the NAR file you want to view and open.
Because the NAR file can contain many hours (sometimes multiple days) or performance data, you will be prompted to set a time range. The default times will show all data available in the archive. If you want to narrow down to a smaller time range, change the Graph Start and End times, otherwise just click OK.
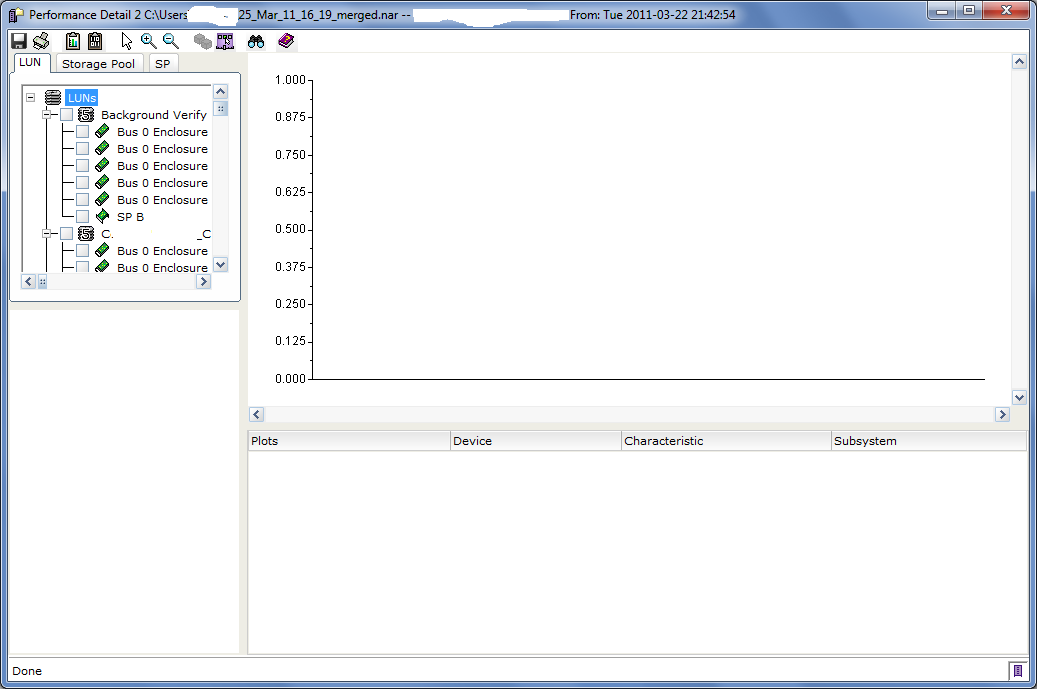
The Performance Detail window will launch and the LUN tab will be selected. No items should be selected and as such no data will be graphed.
My personal methodology is to take a top-down approach when it comes to performance analysis and troubleshooting.
- Check the SP’s, Cache, and SP Ports for obvious issues. If a user is complaining of poor performance the Cache is usually the first place I look.
- Drill down to RAID Groups, Pools, and LUNs to find the culprits
- Drill down to the physical disk level if necessary
- Export data to Excel for better graphs that make it easier to see whats happening
<< Back to Part 1 — Part 2 — Go to Part 3 >>


Jim
March 31, 2011 at 1:50 pm
My clariion performance archives only create .naz files. What do I do?
CX4-240 FLARE-Operating-Environment 04.29.000.5.003
storagesavvy
March 31, 2011 at 2:15 pm
If it creates NAZ files, it unfortunately means Analyzer has not been licensed on the array. NAZ files are encrypted versions of the Analyzer archives, which only EMC personnel can open and look at. Engage your sales team for analysis or open a case if you have a performance problem and they can use the NAZ file.
Performance Analysis for Clariion and VNX – Part 1 «
April 1, 2011 at 10:56 am
[…] Go to Part 2 >> […]
Brian
April 11, 2011 at 6:01 am
When should we expect to see Part 3? I like the idea of graphing the NAR data in Excel so I’m anxious to see how this is done. Thank!
storagesavvy
April 11, 2011 at 9:52 am
It’s coming soon.. (I’m working on it now actually). Last week was pretty hectic.
Performance Analysis for Clariion and VNX – Part 3 «
April 11, 2011 at 11:01 am
[…] << Back to Part 2 — Part 3 — Go to Part 4 >> […]
Brian
April 12, 2011 at 6:20 am
Ask and ye shall receive! 🙂 Thanks for posting the third installment, very informative. I’m still VERY interested in understanding how you plug the NAR data into Excel in order to produce the nice charts. Just wondering if you might be willing to send me an e-mail with a high level overview of how you accomplish this? If you could I’d be very grateful. Thanks again for all the usefull information!
Marty Kilroy
June 14, 2011 at 4:35 am
“In the drop down menu change to the “Unisphere Server – 127.0.0.1” which will change the main screen to Event Notification most likely. Click on Monitoring, then Analyzer.”
All I get when selecting “Monitoring” is an SP Event Logs screen.
I’m finding Unisphere to be very confusing, with EMC Suport unable to help much 🙁
storagesavvy
June 14, 2011 at 10:29 am
The default screen when you click on Monitoring is the Events one, along the top there is a line of “breadcrumbs”. You have to sort of backtrack to the monitoring screen, then click Analyzer.
FYI, on VNX systems, Analyzer is now just called Statistics.
Marty Kilroy
June 14, 2011 at 10:39 am
The problem was found between the keyboard and the seat.
I was clicking on the “Monitoring” text link
(Unisphere Server – 127.0.0.1 > Monitoring)
…instead of the “Monitoring” icon.
Thanks for the reply!!!
Kurt
February 1, 2012 at 1:38 am
Hi, I see if you have to create a mothly report of VNX, then I have to retrieve and merge the nar files of the whole month.
Isn’t that a tedious task?
Is there a simpler way ?