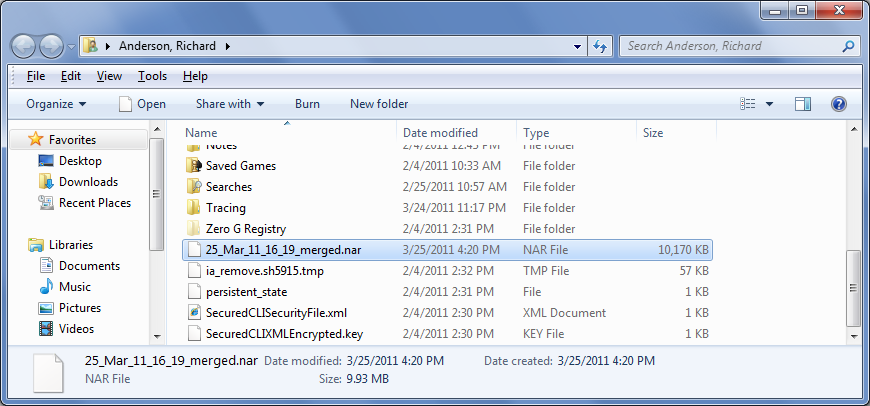
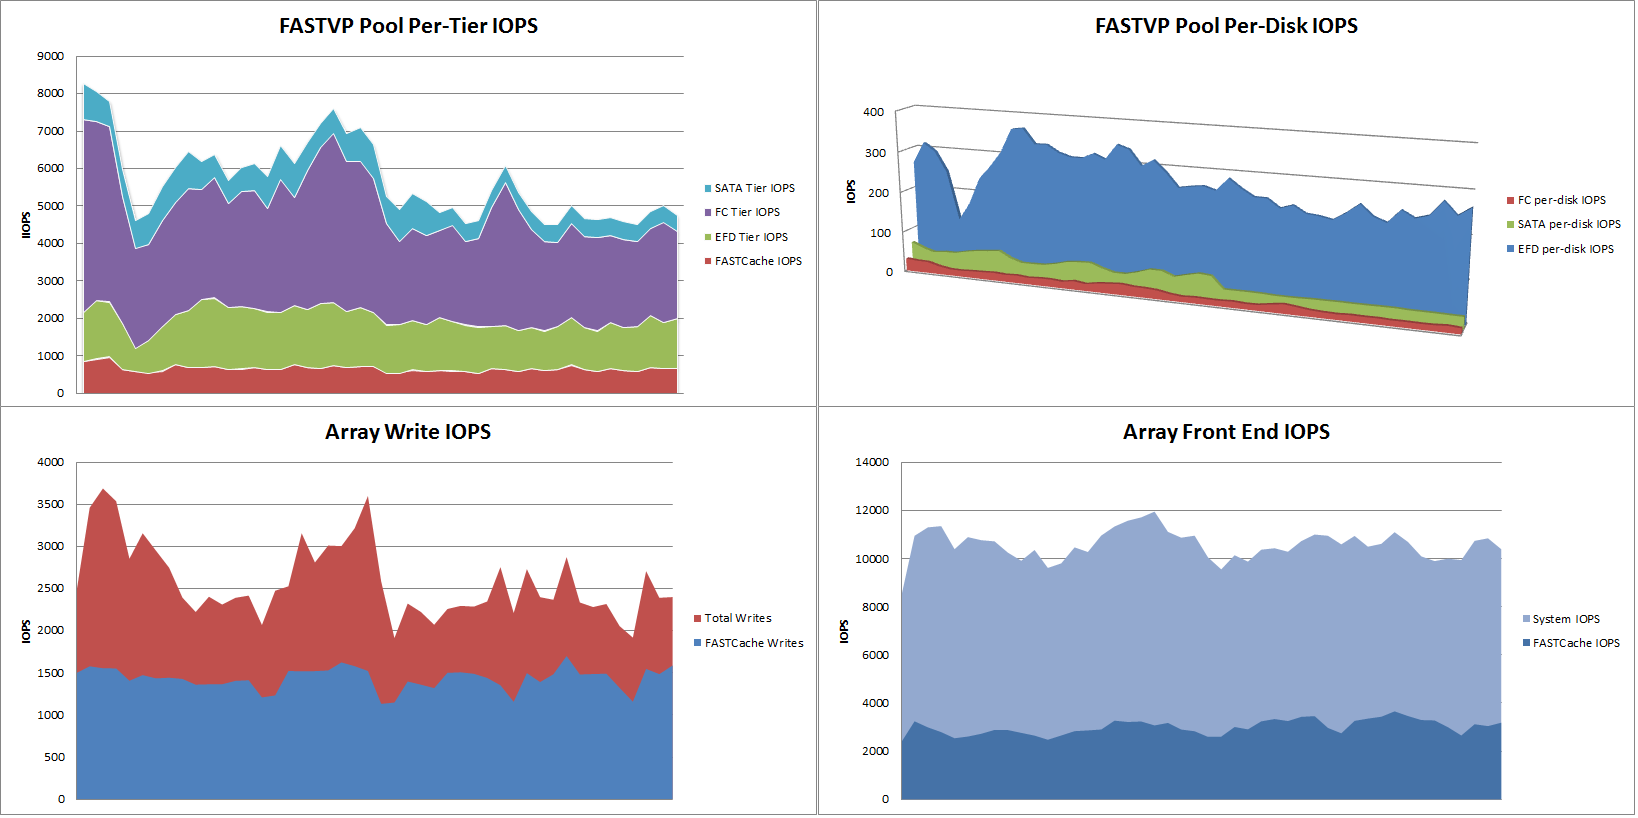
- Do you have an application owner complaining about performance?
- Do you want to get a general idea of how your array is performing?
- Do you want to turn this..
 into this..?
I’ve been doing a lot of performance analysis with EMC Clariion CX3, CX4, and VNX storage recently and have a sort of an informal methodology I follow. I’ve had a couple customers ask me to show them how to get useful data and graphs from their arrays and more recently after posting about FASTCache and FASTVP results I’ve had even more queries on the topic. So I’ve decided to put together a sort of how-to guide. It will take several posts to go through the whole process, so this first post will focus on making sure you have the right tools. The Tools: First, you MUST have the Navisphere/Unisphere Analyzer enabler on the storage array. If you don’t have it, all you can really do is send an encrypted archive to EMC for help when you have a performance problem. Analyzer is an indispensable performance analysis tool for CX/VNX systems and is really quite powerful. Unfortunately, many customers don’t see the value during the purchase process but end up needing it someday in the future. Make sure Analyzer is included in EVERY array purchase.
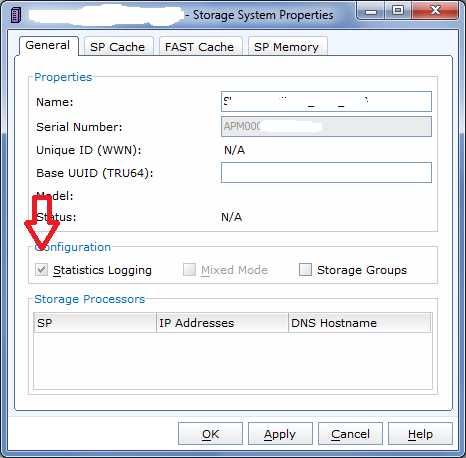
If you haven’t already, you also need to enable Statistics on the array AND in more recent versions of FLARE you need to enable Archive Logging. Statistics logging is enabled in the array properties dialog, shown here…
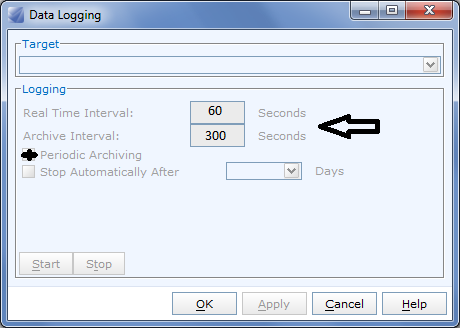
Archive Logging is enabled in the Monitoring -> Analyzer -> Data Logging dialog, shown here…
In practice, 5 minutes is a good interval for archives. Also make sure that periodic archiving is enabled which will generate a new NAR file every so often (it depends on the interval)
Next, you need an Analyzer workstation. You can run Analyzer directly off an array through Navisphere Manager or Unisphere but I prefer installing the software directly on my PC. It lets me work on the analysis from home or anywhere else, and since I look at data from many different customer’s arrays’ it’s easier. You can download the latest version of Unisphere Server and Unisphere Client directly from PowerLink (Home > Support > Software Downloads and Licensing > Downloads T-Z > Unisphere Server Software). Once you install both, you can launch the client and log in to your local Unisphere server. You can then open Analyzer archive files (NAR files) from any array for analysis. Third, you need a graphing tool. I currently use Microsoft Excel 2010 on the same workstation as my Unisphere installation, which happens to be my corporate laptop. While Analyzer does graph the data you select, there is only one type of graph available and sometimes when many objects are being graphed together it’s almost impossible to actually compare them to each other.
Another reason to use Excel is that while Analyzer has a wealth of different statistics available for all sorts of array objects, there are some exceptions right now. For example, if you are using newer features such as FASTCache or FASTVP on your array and want to see statistics for those technologies, there is not much in Analyzer to see. I’ll go through some methods for teasing that data out as well.
Part 1 — Go to Part 2 >>


Jim
March 31, 2011 at 1:52 pm
Unisphere Server won’t run unless it can connect to an array. I assume you have an iSCSI connection to some array???
storagesavvy
March 31, 2011 at 2:18 pm
Unisphere Server does not require an array to run. It actually sort of emulates an array in a way on your workstation.
xuming
April 1, 2011 at 3:43 am
Wow, great post and thank you very much! 🙂
Performance Analysis for Clariion and VNX – Part 2 «
April 1, 2011 at 10:57 am
[…] Performance Analysis for Clariion and VNX – Part 1 […]
Automating NAR file collection « Sudrsn's Blog
April 11, 2011 at 7:31 am
[…] Anderson has been writing a series of posts on collection and Analysis on NAR files over here at Storagesavvy . This post will however will show a small script based on Navisphere CLI that […]
Marty Kilroy
September 12, 2011 at 3:33 am
“If you haven’t already, you also need to enable Statistics on the array AND in more recent versions of FLARE you need to enable Archive Logging. Statistics logging is enabled in the array properties dialog, shown here…”
How do you navigate to “Storage System Properties?”
Marty Kilroy
April 3, 2012 at 4:07 am
Bring up the system menu and select – “Storage Hardware”. On the screen that loads select “System Properties’ on the right side. A new window will open and the “General” tab should be active; from there enable “Statistics Logging”.
Brajesh Panda
November 4, 2011 at 12:47 pm
Am I understanding correct? – In Data Logging window Real time interval means, it will try to capture data after every x number of sec & Archive Interval means after x number of seconds it will create a new NAR (archive) file.
storagesavvy
November 7, 2011 at 10:42 pm
Real Time interval is the interval between polls when watching the performance of the array in “real-time” view. Archive Interval is the same thing but applies to the archive files that are being created. So if Archive Interval is set to 5 minutes (300 seconds) then there will be polling data in the archive file equivalent to every 5 minutes. Real-Time interval is only used when you are using the Analyzer Real Time analysis.
Side Effect: Since there is a specific total number of polling cycles in the archive file, shorter intervals mean more archive files per day, longer intervals mean fewer archive files per day.
Fang the Peg » Performance Analysis for EMC Clariion Arrays
February 29, 2012 at 11:10 am
[…] http://storagesavvy.com/2011/03/30/performance-analysis-for-clariion-and-vnx-part-1/ […]
Jeremy Bradshaw
December 4, 2012 at 7:02 am
Would you be able to comment on the performance impact of leave Performance Data Logging on all the time (with the default of 300s polling interval)? My workplace says it’s bad but I think we want it so we can actually troubleshoot issues when they are reported.
John B
April 19, 2013 at 10:09 am
Does anyone have a slide that compares the CX to the VNX?
spyros
December 6, 2013 at 7:04 am
emc.mitrend.com
Just upload those there, and you will be OK