Category Archives: renewable energy

One Month With a Solar Home – 1.82MEGAWatt(hours)!

Posted on by 0 comment

Version 2

Well, it’s been just over a month since the solar system came online..

In the 33 days that the solar system has been online, we’ve generated a total of 1817kWh from the panels.. Due to line losses and differences in measurement intervals and such the PSE Production meter has registered 1724kWh.

  • For the Washington State REAP program that we are participating in, that 1724kWh translates to ~$930 in state incentives generated so far.

The PSE Net meter which is what our monthly power bill is based on has two useful values..

  • First, we’ve pushed a total of 1205kWh of excess solar power to the grid. This means that from the solar power itself, during the day, we’ve consumed 519kWh that came straight from the solar panels and didn’t have to be pulled from the grid.
    • On a more grand scale, the full 1205kWh is power that didn’t have to be generated somewhere by a Nuclear, Gas, Coal, etc power plant.  What happens if you scale that up to more homes?
  • Second, we pulled a total of 602kWh during the same period, primarily at night when the solar panels are not generating any power.
    • Now, what if the excess we pushed into the grid above was stored at the power company’s neighborhood substation in a bank of batteries (Tesla Energy?) and then this power that we pulled at night came from those batteries.  Suddenly the power generation get’s much simpler and demand spikes are smoothed out…  But I digress.

So our total consumption of power during the 33 days was about 1121kWh, and we generated 1724kWh.   Due to how net metering works, our electric bill will now have a credit equal to 602kWh. Unfortunately, because the power company fiscal year is July through June, this credit is more or less a throw-away.. It get’s zeroed out at the end of June. But going forward from July until June 2016, as we generate more credit we will be able to consume that credit during the winter months as needed to cover the difference between what we generate and what we consume.

Oh, it’s freakin’ HOT here right now compared to normal, and we have no AC, so the furnace fan and about four other fans are all running pretty much non-stop. This combined with charging our electric car (actually a very small amount of power) is pushing our power consumption up a bit higher than normal. Typically we consume about 100kWh more in August than in other months due to running the fans, but we’ve had a very warm spring, today (July 1st) it’s 92F here and the average is only 73F. The record for this day, prior to today was only 84F.

At $0.10/kWh, we would have paid about $100 for electricity. But instead the power we pushed to the grid has more than offset that and our bill will essentially be ~$7 for the base connectivity charge.

You can browse around my online solar reports if you want – StorageSavvy’s Solar Dashboard

StorageSavvy is going green! I see the light!

Posted on by 1 comment

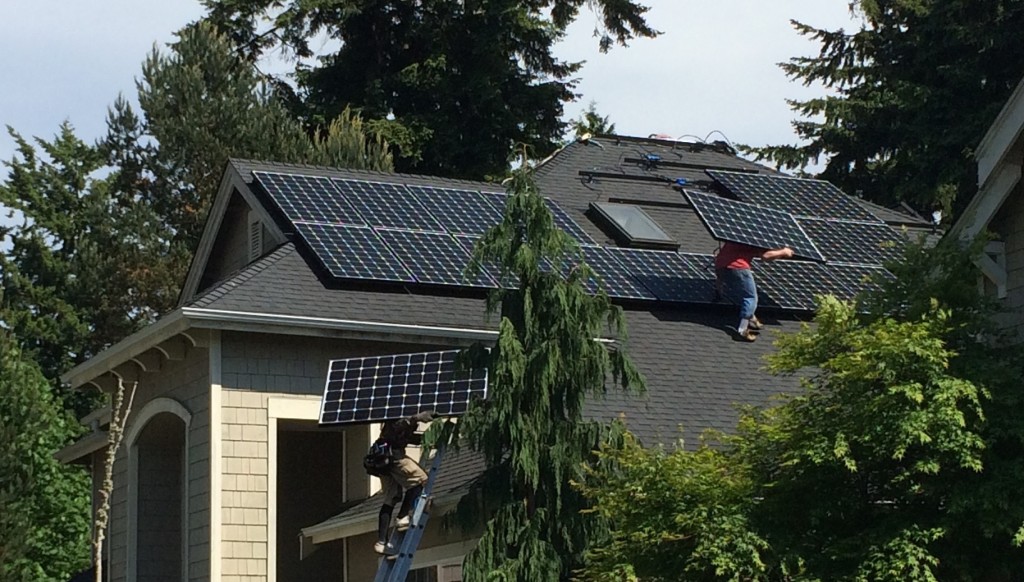
Through a series of discussions with a friend who was evaluating solar for his home, doing some calculations, and discussing with the local contractor, I bit the bullet last month and got a 9800 watt solar array installed on our house here in the Pacific Northwest.  While pricey up front there are a number of incentives available from the Federal government as well as Washington State that effectively pay for the entire system.  I’ll write-up the cost analysis later but for now let’s take a look at the performance of the system..

Version 2The roof of our house has 4 sides with trees lining the entire East side of the property, causing some shading in the morning.  The majority of the North and South sides are clear and the West side is completely open.  Due to this, the 35 x 280 watt panels cover pretty much the entire West roof and a large portion of the South roof.  Our system uses the more expensive micro-inverters in order to handle shading of a single panel without affecting the rest of the system.  Aside from more efficiency in shading situations, the micro-inverters have about double the life of the less-expensive in-line inverters.  Our system is also grid-tied and we do not have any batteries involved.  Since the micro-inverters push 240VAC power down from the roof, the interconnection with our panel is very simple.  In order to take advantage of Washington State’s solar incentive the local power utility (Puget Sound Energy) installed a “Production Meter” that measures how many kWh’s the system generates irrespective of how it gets used.  And in order to take advantage of the grid-tied solar system to reduce my power bill they installed a new digital “Net Meter” that tracks both how much power I consume from the grid and how much our system pushes TO the grid.  The difference between those numbers determines the actual billed amount each month.

For example, if we push 1000 kWh into the grid during the month, and pull 900 kWh, then our bill that month will show a credit equal to 100 kWh.  That credit can be used in a later month (ie: the winter months) when we might be consuming more than we generate each day.

At about 7pm PT today pulled statistics from the micro-inverters as well as the current readings on the ‘net’ and ‘production’ meters.  The system came online during the morning of May 29th.  The cumulative numbers for the past ~12 days are as follows..

  • Production Meter
    • 580 kWh‘s generated by the solar array
  • Net Meter
    • 378 kWh‘s pushed to the grid
    • 205 kWh‘s consumed from the grid

Doing the math, this means we’ve consumed approximately 387 kWh in that time from all sources (grid + solar).  The summer has pretty much started here so at least for this time of year we are clearly generating significantly more that we consume.  The winter months will be different of course.  This also translates to a 173 kWh credit on our electric bill so far.

Let’s take a look at how the system performs on different days and at different times of day..

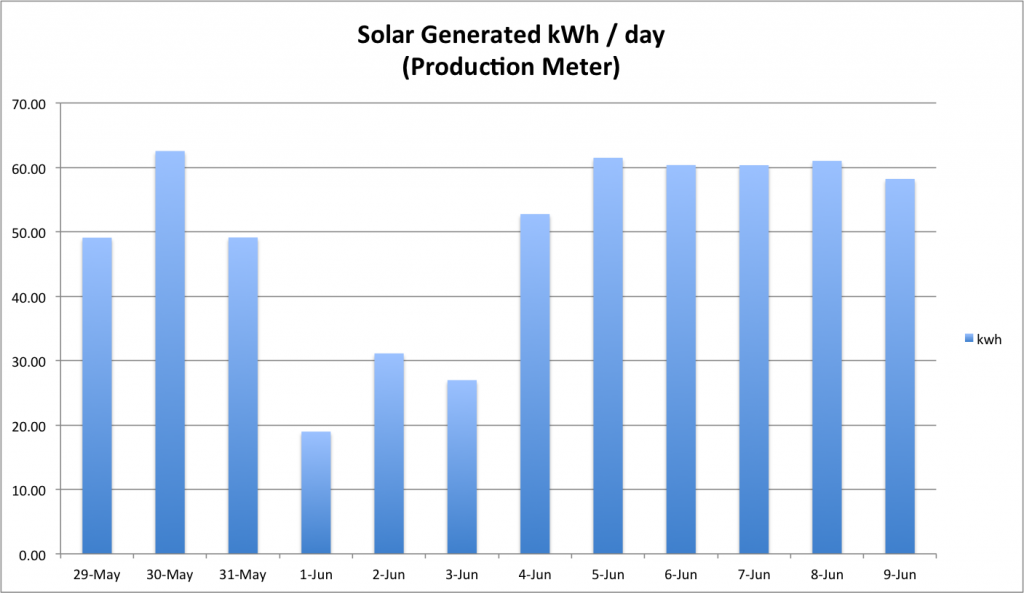
First, here is a look at how many kWh’s we are generating per-day.  You will see that there are some stormy, rainy, cloudy, dark days mixed in with the other more sunny days..

kwh-per-day-solar

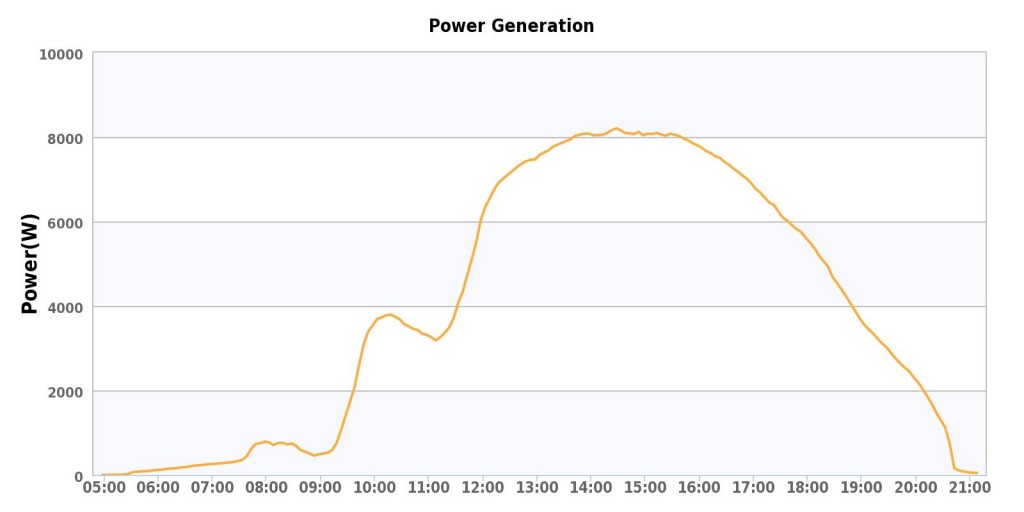
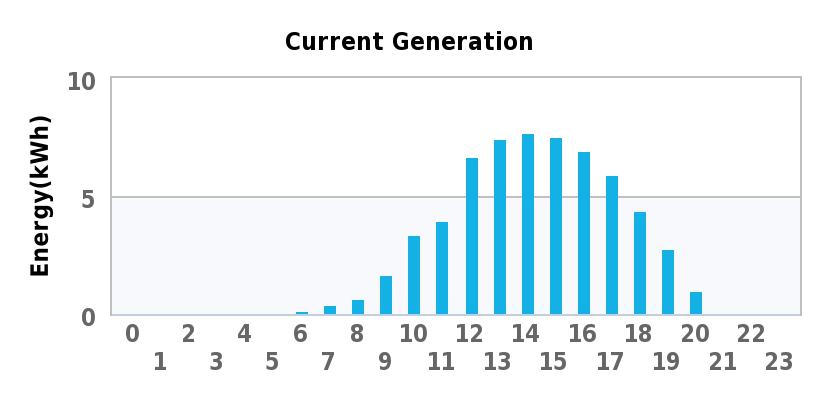
Now here are two charts, the first showing the amount of power being generated in watts through a 24 hour period on a nice sunny day and the second showing the number of kWh’s generated in each particular hour.

watts-24hours-sunny

You may notice the dips around 9am and 11am.  These are caused by the south side panels being partially shaded at those times as the sun moves across the sky.
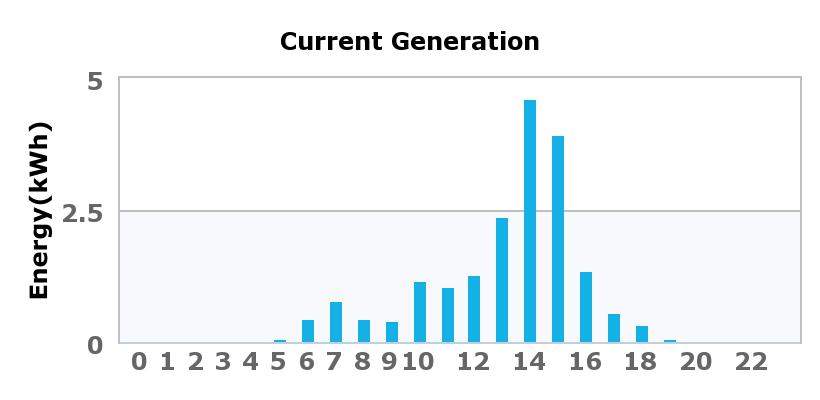
kwh-per-hour-sunnyHere are the same two charts for the darkest, cloudiest, rainiest day we had a quite a while.

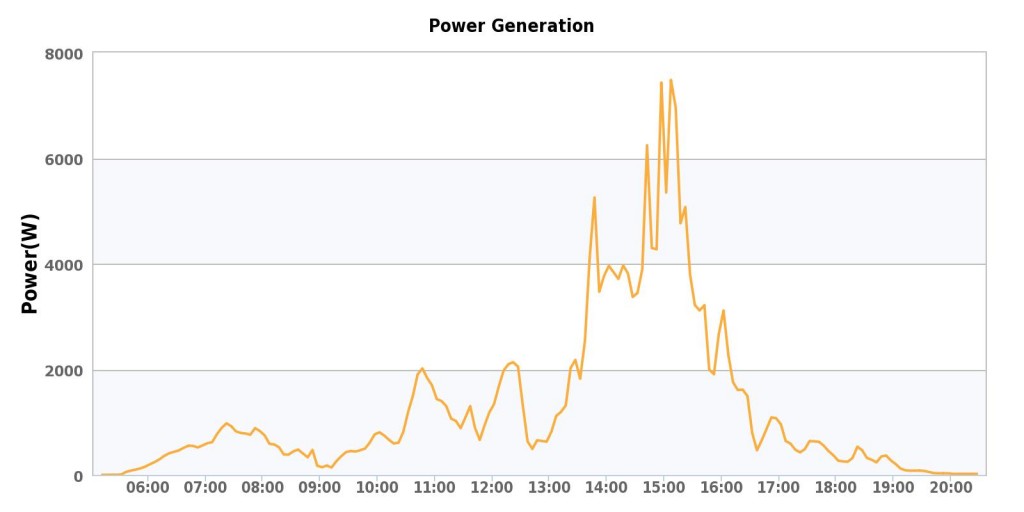
watts-24hours-rainy

As the clouds and rain change through the day, you can see that the power generated is all over the place.  I was impressed that we still achieve over 7000 watts mid-afternoon on that day, if even for a short time.

kwh-per-hour-rainyWhen you consider that there are comparably few days this bad in a given year, and we still generated about 75% of our average daily consumption rate, things are looking pretty good for an overall annual low electric bill.

All in all pretty promising — and we recently leased a new all-electric BMW i3 which we charge about once every 3 days.  That charging activity is included in all the above numbers so we are essentially powering the i3 entirely from the sun.  On the flip side, our house contains probably 50 x 65w can lights of which only a few have been converted to LED so far.  We could certainly reduce our power consumption a bit more if we converted more of our lighting to LED.  But there is a cost to that of course and it’s a long-term project.  Assuming our annual out-of-pocket electric cost ends up being zero, there’s really no ROI on replacing our bulbs with LED before the existing bulbs fail on their own.

More on this project later.